Research Article - (2018) Volume 8, Issue 1
This paper presents a way of detecting twelve daily physical human activities such as sitting, laying, standing, attaching to table, walking, jogging, running, jumping, pushups, stairs down, going up stairs, and cycling with acceleration and gyroscope sensors data resulted from using android smart mobile phones. An android application was developed to collect raw data from the sensors. The subjects preformed the twelve activities with smart phones where it is installed. Five of the samples had been selected as train data, while the rest ten samples selected as test data. In order to classify the subjects’ raw data, a program in Matlab R2016a was developed that applies twelve supervised classification algorithms models, and then compare between them in term of accuracy and speed factors. The twelve models are divided into two categories: Six of them under support vector machine (SVM); while the other six are under the k-nearest neighbor (k-NN). Finally, this study has the following results: The overall average accuracy rate with SVM cases is 89.79% in comparison with 87.81% for k-NN. The average speed rate is 47 seconds in SVM cases whereas it is 39 seconds in k-NN cases. With expansion of the number of activities up to 12 human actions, the result of the study showed that a good performance in terms of accuracy and speed was gained without losing an accuracy level achieved in the previous studies where maximum 8 activities were handled.
Keywords: Accelerometer; Gyroscope sensor; Human activity recognition; k-NN, Support vector machine
The most vital and essential feedback needed to develop smart internet of things (IoT) applications, is the outcomes from the process of perceiving human behaviors and their physical interaction with the surrounded. In order to obtain an accurate and useful feedback about human behaviors and interaction, integrating the inferring and sensing factors was needed by using Human Activity Recognition (HAR) research field. This research field attracts most researchers nowadays. However, this interest comes from the need of gaining the contextaware data; which in its turn are employed in providing a personal support to the users over a wide diversity of applications sets, such as security, medical, military and life style wise applications. The process of accurate recognition of daily life activities such as walking, standing, running provide a very important feedback to both the user himself and the care provider. For instance, the daily detected observations about patient activities produced by patient’s body movements will be quite useful in preventing him/her from performing certain activities which could be considered abnormal or harmful to the health due to the illness or disease history status. Moreover, these daily detected observations could be useful to user health status by providing him/ her comments, tips and reminders over the received analysis about their daily activities performance; which eventually will aid the users enhancing their life style condition.
There are two kinds of machine leaning algorithms techniques for processing and analyzing HAR data which widely known: Supervised and unsupervised machine learning algorithms. In supervised learning, sustaining the used algorithm with prior knowledge and to label the data manually were needed. To achieve this, training data sets, which are basically the standard data, should be created and fed to the used algorithm. In this case, the algorithm will be trained to apply the required processing steps over the received data from the users which commonly called test data. Like in works, researchers used the supervised machine learning techniques to process and analyze their samples [1-5]. On the other hand, unsupervised learning does not need a prior knowledge. Thus, making the unsupervised learning in alignment with artificial intelligent term directly; because the unsupervised algorithm is built up to solve complex issues recognizing certain patterns without human interference. In researchers applied the unsupervised method over their data samples [5-10]. There are two main factors to choose which kind of machine learning algorithms are suitable to your research: The volume and the structure of your data. Since the volume of data used is not huge and the complexity level is not high, the supervised algorithms support victor machine (SVM) and k-nearest neighbor (k-NN) were selected to use in this work.
SVM algorithm is generally used to achieve regression or/and classification tasks; however, it is commonly used in classification cases. In SVM, the data are processed by plotting as a feature point in a dimensional space of a size” n”; where n represents the total number of features. After the plotting process, a classification process took place to distinguish between the different groups of data and their classes. This step will be fulfilled by specifying and locating the hyper-plane that differentiates the different classes. k-NN algorithm is also used for the classification or/and regression tasks. In both tasks, the group of the data feature contains the k-closest training set in the working space. k-NN only differs from the SVM that it does not require a learning process to have a proper knowledge about the training data set like in SVM case.
In this work, the data from two types of sensors were used: Gyroscope and accelerometer sensors, which are available in most smart phones nowadays. Accelerometer sensor measures linear acceleration based on vibration. The typical two axis accelerometer gives users a direction of gravity. In general, speed and direction were obtained from accelerometer data after analyzing it. On the other hand, the gyroscope sensor measures the rate of rotation around a particular axis (Angular velocity) by using the key principles of angular momentum, which helps in indicating orientation.
Related works and contribution
Generally, the current researches on HAR use three methods to detect the activities: vision-based, wearable and smart phone device. At the vision-based method a camera is used to make video recordings and then a specific type of algorithms is used to analyze the video and detect the activity type from each video frame. Like in Dinesh Singh and C. Krishna Mohan [11], they used graph kernel SVM and video activities graph formulation for recognizing the abnormal activities for people during their presence in different public places such as parks, airports, malls and metro-stations. This method might create some obstacles as the camera should be installed at a fixed location and processing time to classify a certain activity. The other method of activities detection is the wearable device, where users put on a device contains embedded sensors like accelerometer, compass, GPS and gyroscope; these sensors aim to detect postures and movements from the user’s body at certain moment. On the other hand, Timo Sztyler and Heiner Stuckenschmidt used in their work wearable devices for HAR, they have applied online classifier to have continuous adaptation model [12]. They tested their approach by putting wearable devices on fifteen participants then analyze the outcomes. This method has two major problems: The first one is that people are not feeling comfortable wearing the device for a long period. Secondly is the weight and battery life of the device. The smartphone method is the most ubiquitous used method; the smart phone contains embedded sensors similar to the one in the wearable device case with smaller size. The user in this method will put the smart phone in his/her pocket and practices the daily activities; then the different embedded sensors will read and record the user body postures and movements, analyze and classify them. Researchers in works used the smart phone and its embedded sensors as powerful tool for gaining the feedback from the user body movements to detect the user daily activities behaviors [13-17]. The researchers succeed in building up many models based on monitoring the users’ attitudes. These models serve different purposes; such like health, security and lifestyle aspects. This research focuses on the smart phone device method.
Many researchers studied the HAR approaches where their researchers have been built in using smart phone. Like in work, they used the smartphone to collect the raw data from working labors in construction filed by using embedded accelerometer and gyroscope sensors inside the smartphone. They classified eight activities such as sawing, hammering, turning a wrench, loading sections into wheelbarrow, pushing a loaded wheelbarrow, dumping sections from wheelbarrow, returning an empty wheelbarrow, and being idle. For the recognition matters, the researchers targeted time-frequency domain features similar to what was done in this work. They used five supervised learning techniques for classification purpose; which are decision tree, k-NN, SVM, logistic regression and neural network. They concluded that neural network scored the best result of accuracy in the activities classification; with accuracy ranges from 62% to 96% for userindependent case. In work case, the researchers just used one embedded sensor in the smartphone [18,19]. They used the accelerometer sensor; unlike others, who used tri-axis acceleration raw data and phone placement information resulted from the smartphone sensor as their targeted feature. Their aim from using tri-axis acceleration along with phone placement information was to decrease the power consumption ratio over the mobile battery by reducing the processing demand over the mobile CPU. They recognized five activities: standing, walking, running, walking upstairs and walking downstairs. Compressed sensing method had been employed into their work to classify tri-axis acceleration and phone placement information data. The achieved accuracy in the classification phase was 89.86%. Three embedded sensors in smartphone had been used in work for HAR matter: Acceleration, gyroscope and accelerometer linearity [20]. The researchers adopted time-frequency domain technique for their list of targeted features. The researchers recognized 6 activities; sitting, standing, walking, up-stair, down-stair and lying. The SVM classifier had been used and scored 89.59% accuracy rate in the classification phase.
In this study, Attal et al. work have been followed in term of doing comparison task between more than one classification algorithm case [21]. To achieve the recognition process, a procedure using certain type of hardware and software was applied as shown in Figure 1.

Figure 1: Human activity recognition chain of steps flow chart.
Data acquisition and segmentation
A smart phone that embedded accelerometer and gyroscope sensors inside it along with the Wi-Fi capability is used. Through our system the collected raw data will be sent from the mobile to the computer via the Wi-Fi using TCP connection as shown in Figure 2. After the android application triggers the TCP request, the raw data will be sent as UDP datagram to the desktop to be processed and analyzed by using Matlab R2016a.

Figure 2: Data flow from smartphone to the laptop.
In data acquisition phase, the raw data have been collected by using android application that reads these data from the accelerometer and gyroscope sensors and saves the data in text file format to do further processing over it. In this work, twelve activities were targeted (attach to table, standing, walking, laying, sitting, jogging, jumping, pushups, stairs up, stairs down, bicycling and running) to be detected and recognized. For classification phase, software in Matlab R2016a was developed that applys twelve supervised classification algorithms models and do comparison between them in term of accuracy and speed factors. The twelve models are divided into two categories, six of them under SVM algorithm: (Linear SVM, Cubic SVM, Coarse Gaussian SVM, Medium Gaussian SVM, Fine Gaussian SVM and Quadratic SVM) while the other six under the k-NN as (Linear k-NN, Cubic k-NN, Coarse k-NN, Medium k-NN, Cosine k-NN and Weighted k-NN).
The experiments have been carried out on a group of fifteen volunteers aged between 19-35 y. The volunteers performed twelve activities as they have smart phone in their pockets (operating on android). Any activity can be performed for any time duration in any order. Like walking for 30 sec, sitting for 1 min, laying down for 40 sec etc. The acquired data collected from the fifteen subjects with their complete consent and kept indexed as anonymous.
By using its embedded accelerometer and gyroscope; 3-axial linear acceleration (for speed and directions) and 3-axial angular velocity (for orientations) were captured at a constant rate of 50Hz along with window segment contains fifteen samples. In the segmentation phase, each segment including fifteen samples alone as a part of the raw data signal was processed and analyzed; then it was compared with the processed and analyzed whole signal segments at once. The compression of handling the whole signal or single segment is based on two factors: Processing time and accuracy. The obtained data set was randomly partitioned into two sets, where 33% of the volunteers were selected to generate the training data and 67% for the data set.
Pre-processing
Pre-processing the raw signal data is one of the most important steps in signal processing. It consists of normalizing raw data, filtering raw data, selecting features and extracting features. In this study, a mix between two types of features was used as illustrated in Table 1: Time and frequency domain features. From time-domain features mean, median, variance, range, average and standard deviations (SD) statistical features were selected to be used. From frequency domain energy, correlation, velocity, acceleration, fundamental frequencies (using Discrete Fourier Transform (DFT)) and signal peaks (using Power Spectral Density (PSD) were used.
| Feature | Type |
|---|---|
| Mean | Time-domain features |
| Median | |
| Variance | |
| Range | |
| Average | |
| Standard deviation | |
| Energy | Frequency-domain features |
| Correlation | |
| Velocity | |
| Acceleration | |
| Fundamental frequency | |
| Signal peaks |
Table 1: List of features.
In order to find out the frequency spectrum of the discrete data signal x, Discrete Fourier Transform (DFT) is used. The DFT described as in below equation:
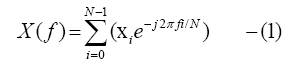
Where X refers to the frequency spectrum, f for the Fourier coefficient in the frequency domain and N the length of the sliding window. The number e”Euler's number” is a mathematical constant that is the base of the natural logarithm [22]: The unique number whose natural logarithm is equal to one. It is approximately equal to 2.71828.
The result of squaring the summation of spectral coefficients normalized by the length of the sliding window is Power Spectral Density (PSD) as shown in the following equation:
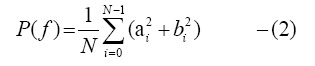
Where a, b are the orthogonal components of accelerations. In each window slide, correspondence between the highest computed density of the power spectrum and the frequency represents the peak frequency of that given signal [23].
The value of raw data sampling rate is not accurate at 50 Hz; this refers to the fact that during the raw data acquisition phase it could be subjected to slight changes due to the hardware limitation; which in its turn may produce a non-unified data and this will have an impact on the outcome. To overcome the non-accuracy status, resampling algorithms were used to ensure that the sampled data will be unified at 50 Hz accurately. The aim from that is to reach better outcome by having the optimal identification for the features and improve the classification performance. In this research, built-in Matlab functions smooth, sort, acc, varfun, pca and horzcat were used over the accelerometer and gyroscope sensors data signals to apply normalization process over them. In feature selection, the built-in function abs in Matlab was used by applying absolute value.
The first step in feature extraction is to eliminate repetitive data feature which is the first phase in linearization. For this cause, unique and ismember Matlab built-in functions were used. Then, the accelerometer and gyroscope were categorized x, y and z axis into array. The extraction process was carried on by getting the accelerometer and gyroscope data signal size, directions and orientations by having the array of the axis, size, direction and orientation. This information used to calculate the min, max, average, standard deviation, variance, range, velocity, energy and correlation. At the end of extraction phase, linear interpolation is applied which is the second phase of linearization technique to handle any discrepancy in the received raw data from the smartphone. The Euclidean magnitude of a, b and z is calculated to get the magnitude of the acceleration vector by using the following equation:
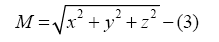
In the merged acceleration magnitude equation number (3), x, y and z values represent the axis. The units for horizontal axis are measured in seconds, where the vertical one measured in m/s2.
Classification
In this phase and as mentioned previously; two supervised machine leaning classification algorithms were used which are k-NN and SVM models as shown in Tables 2 and 3. k-Nearest Neighbors (k-NN) is a supervised classification technique that can be considered as a direct classification method because it does not require a learning process. It just requires the storage of the whole data. To classify a new observation, the k-NN algorithm uses the principle of similarity (distance) between the training set and a new observation to classify. The new observation is assigned to the most common class through a majority vote of its k nearest neighbors. The distance of the neighbors of an observation is calculated by using a distance measurement called similarity function such as Euclidean distance. Moreover, one should note that when using the k-NN approach and a new sample is assigned to a class; the calculation of distances (i.e., the computation time) increases as a function of the existing examples in the data set (Table 2).
| k-NN Models |
|---|
| Linear k-NN |
| Cubic k-NN |
| Coarse k-NN |
| Medium k-NN |
| Cosine k-NN |
| Weighted k-NN |
Table 2: MatlabR2016a k-NN model built-in functions for signal processing.
| SVM Models |
|---|
| Linear SVM |
| Cubic SVM |
| Coarse Gaussian SVM |
| Medium Gaussian SVM |
| Fine Gaussian SVM |
| Quadratic SVM |
Table 3: MatlabR2016a SVM model built-in functions for signal processing.
Support Vector Machines (SVMs), is a classifier derived from statistical learning theory introduced by Vapnik [24]. This well-known machine learning technique minimizes an experimental risk (as a cost function) and at the same time maximizes the margin between the so-called separating hyperplane and the data. In their standard formulation, SVMs are linear classifiers. However, non-linear classification can be achieved through extending SVM by using kernels methods. The key idea of kernels methods is to project the data from the original data space to a high dimensional space called feature space by using a given non-linear kernel functions. Moreover, SVM is a binary classifier; therefore to ensure a multi-class classification, pairwise classifications can be used, which makes it timeconsuming especially in case of a large amount of data (Table 3).
In this section, a comparsion between the use of k-NN and SVM twelve classifiers models in term of accuracy and speed is introduced. The performance of the twelve models over a part of the signal in form of single segment window has been evaluated as shown in Tables 4 and 5. At the same time, the twelve models performance has been evaluated over the whole signal at once as illustrated in Tables 6 and 7.
| Factor / Classifier model | k-NN Models | SVM Models |
|---|---|---|
| Average Accuracy | 86.13% | 87.54% |
| Average Speed(s) | 11 | 27 |
Table 4: Total average result of accuracy and speed factors over a single window slide of size 50.
| Model | Accuracy | Speed(s) |
|---|---|---|
| CGSVM | 84.60% | 29 |
| CSVM | 87.96% | 28 |
| FGSVM | 89.00% | 27 |
| LSVM | 86.30% | 22 |
| MGSVM | 89.10% | 27 |
| QSVM | 88.30% | 29 |
| Ck-NN | 79.36% | 11 |
| COk-NN | 86.63% | 11 |
| CUk-NN | 87.23% | 14 |
| Lk-NN | 86.90% | 11 |
| Mk-NN | 87.66% | 9 |
| Wk-NN | 89.00% | 10 |
Table 5: Average result of accuracy and speed factors over a single window slide of size 50 for each model individually.
| Factor / Classifier model | k-NN Models | SVM Models |
|---|---|---|
| Average Accuracy | 87.81% | 89.79% |
| Average Speed(s) | 39 | 47 |
Table 6: Total average result of accuracy and speed factors over the whole signal.
| Model | Accuracy | Speed(s) |
|---|---|---|
| CGSVM | 86.80% | 50 |
| CSVM | 89.20% | 46 |
| FGSVM | 90.50% | 47 |
| LSVM | 88.10% | 44 |
| MGSVM | 90.40% | 48 |
| QSVM | 90.18% | 48 |
| Ck-NN | 81.80% | 38 |
| COk-NN | 87.85% | 39 |
| CUk-NN | 88.70% | 41 |
| Lk-NN | 87.95% | 39 |
| Mk-NN | 89.80% | 38 |
| Wk-NN | 90.80% | 39 |
Table 7: Average result of accuracy and speed factors over the whole signal for each model individually.
One out of the fifteen data samples has been selected to be presented in this work. The average, energy, acceleration, velocity and displacement of the sample data that have been collected from the accelerometer and gyroscope sensors have been plotted as illustrated in Figures 3-5.

Figure 3: Average accelerometer and gyroscope sensors for one of the samples.

Figure 4: Energy plot of accelerometer and gyroscope sensors for one of the samples.

Figure 5: Acceleration in (millimeter per second squared), velocity in (millimeter per second) and displacement in (millimeter).
The acceleration data have been plotted in respect of time based on time frequency as shown in Figure 6. The total x axis and the highest accuracy model score of the selected sample, acquired from accelerometer and gyroscope sensors, have been plotted depending on the twelve activities in different colors for each one of them as explained in Figure 7. In Figure 8, the accuracy results for the twelve classifiers have been listed in a table form (Figures 7-9).

Figure 6: Accelerometer raw data in respect of time.

Figure 7: The plot of total x axis from accelerometer and gyroscope sensors for the raw data at one sample.

Figure 8: Accuracy results for the twelve classification models with a highlighting of the highest accuracy score over one sample.

Figure 9: The plotting of the highest score of the classification model (fine Gaussian SVM).
This paper highlights the importance of the bio-signal analysis in enhancing our daily basis life style, characterized by the need of the daily feedback about our current health performance status. This daily feedback in return, will help us to have a better control over our health state in general.
The researchers at the recent related works at the HAR field; recognized maximum eight activities by using 1 to 5 classifiers models along with decent classification accuracy results in their researches. While in this research, we managed to expand the number of recognized activities up to twelve human actions. Meanwhile, twelve classification models were used to find out the best suitable model for HAR field. In addition, we achieved a very good level over the accuracy and time factors as a performance indicator to HAR research quality.
After discusseing the results of processing and analyzing the fifteen people signal data samples, the conclusion is: In the case of using the supervised algorithms k-NN and SVM over a part of signal sliced by certain window size, a quite close accuracy results out of the classification process between k-NN and SVM models were gained while the k-NN exceeds the SVM in speed factor matter. In time, if the same classifiers were used over the full signal data at once not just part of it, the performance gab over the speed factor between k-NN and SVM models will be less than the speed results over a segment out of the signal case; but the accuracy will be much more better especially in fine Gaussian SVM model.
Previous research works over the HAR field have dealt with maximum eight activities using 1 to 5 classifiers models along with decent classification accuracy results. Our major effort was to expand the number of recognized activities up to twelve human actions without sacrificing an accuracy level achieved in the previous studies; simultaneously twelve classification models were employed to find out the best suitable model for HAR field among them. A good performance level in terms of both the accuracy and time factors was achieved, and so gained a good sign to be able to move towards more than 15 or even more than 20 human activities for their classification. With a nice and acceptable accuracy level in our study, future work will be towards a comprehensive, enhanced and widely applicable human activities recognition system that will improve the people life style in many aspects and perspectives.
This research was supported by Basic Science Research Program through the National Research Foundation of Korea(NRF) funded by the Ministry of Science, ICT & Future Planning (NRF-2017R1D1A3B04032905).
