Commentary - (2016) Volume 6, Issue 2
In its broadest term, economic evaluation (EE) is a comparative analysis of the input (costs) and the output (consequences, outcomes) of two or more alternatives to see if they are economically beneficial or feasible. The earliest form of economic evaluation took place in mid-19th century and since then; three main forms of EE have evolved which are employed in various settings: cost-benefit analysis (CBA), cost-effectiveness analysis (CEA) and cost-utility analysis (CUA). Intended as a primer reading for clinicians, this article starts with the fundamental concepts of economics (e.g., costs, benefits, supply and demand, utilities and efficiency) and then combine them into principles for each tool for EE. The article will present a narrative critique of each EE in the context of modern healthcare system. As a conclusion, the article will mention some of the major challenges of these EE tools plus the role of sensitivity analysis.
Keywords: Health economic evaluation, Cost-effective analysis,Cost-benefit analysis, Cost-utility analysis
Costs, benefits, supply and demand
In any non-utopic society, resources (or goods) are finite (hence scarce) and they are constantly distributed to individuals to satisfy their needs (wants and preferences). Resources have to be produced (by sellers) to replenish consumption by individuals(consumers), who willingly let go of other resources (money) to accrue the resource(s) of their preference (consumer choice). Such transaction (bought and sold) between a consumer and seller is a re-allocation of resources (supplier’s good versus consumer’s money) at a mutually agreed price, where consumers’ willingness to pay meets sellers ‘willingness to accept. Here, consumers enjoy a benefit from the good/service by paying sellers the costs of the goods. In any market free from monopoly or regulation, this transaction price indicates equilibrium between supply and demand (Figure 1).

Figure 1: Classic Supply and Demand curve that determines the agreed/transaction price of any utility in a free consumers’ non-barter economy.
However, when more than one individual consume the same set of resources, competition will arise: as the net resources decrease the equilibrium price will shift, so that only the individual(s) who can now pay a higher price will continue to consume the decreasing resources. On the contrary, when resources become more available than needed, an excess will be left around and hence the demand falls and pulls down the equilibrium price. John Locke, an English philosopher and physician, first described this inverse supply-demand relationship in his writings in 1691, but the actual term “supply and demand” was not coined until 1767 by Denham-Steuart and Adam Smith, in his famous work of “the Wealth of Nations” [1,2]. By definition, supply and demand for any resource or commodity are susceptible to external constraints like weather (under- or over-production) and disasters that will compromise human viability (under-demand of luxurious items and over-demand of basic commodities) (Figure 2).

Figure 2: Scenarios when supply and demand curves shift. For a commodity X in a society, there exists an equilibrium where supply curve S1 intersects demand curve D1, at the agreedutility(price) of U3 for a Q4 quantity of X. An epidemic came killing 15% of population and sent the economy to recession, shifting the demand curve for X to the left to D2 (now less people in total and less money earned). If the supply remained the same S1, it will be relatively in excess and hence the agreed utility (price) will fall to U4 for a lesser quantity of X (Q3). Now, if the production of X also fell, the supply curve will be shifted up to S2(harder to produce the same unit of good/service), leading to a higher agreed utility/price of U2 for a much less quantity of X.(Q1).
Utility, marginal utility and indifference curves
In economics, a preference for resources/goods or their perceived satisfaction is called utility. This concept of utility enables economist to understand consumers’ choices and decision-makings for commodities and services. The term “marginal utility” refers to the extra utility gained with acquisition of the next increment of goods/service. In 1844, French engineer Jules Dupuit described the concept of “diminishing marginal utility”, which stated that the added benefit or satisfaction for the next unit of good consumed will be smaller than that from the previous unit (i.e., ΔMU1 > ΔMU2) [3,4] (Figure 3).

Figure 3: Curve of Diminishing Marginal Utility which doubles as the axiomatic Demand Curve. Here the marginal utility for next unit of good consume (ΔMU2) is less than that from the previous unit (ΔMU1).
When one equates marginal utility to willingness to pay (i.e., price), Dupuit’s curve of diminishing marginal utility becomes the fundamental demand curve and hence, providing a proof for it (Figure 1).
Where there is more one good to consider, a consumer can express several combinations of goods in different bundles as equal preference (or indifference). This concept was described by Edgeworth in 1881. Graphically, such points of equal preferences will link to form an “indifference curve” for any two goods as per consumer’s utility level [5] (Figure 4).

Figure 4: Indiference curves showing three utility levels (U1, U2, U3) of the same or different consumers. Here, for consumer with utility level U3, the bundle of (Q1A Good A and Q1B Good B) is indifferent to (Q2A Good A and Q2B Good B). If the consumer’s utility now changed to U2, for the same quantity of Q1A and Q2A Good A, the new indifferent quantity of Good B will hence be Q4B and Q3B respectively.
Indifference curves are rarely static, as utility changes in time with the consumer’s preferences and willingness to pay, hence the indifference curves will shift both in shape and in positions (Figure 4).
The concept of indifference curves is crucial for understanding the interplay between consumers’ choices and constraints.
Edgeworth box and Pareto efficiency
When more than one individual interact and demand from with the same set of resources, their utilities inevitably compete and ultimately reach equilibrium with his/her own set of preferences and wants (Figure 5).

Figure 5: Individuals A and B with their indifference curves showing different levels of utilities 2.
In 1906, Vilfred Pareto extended Edgeworth’s indifference curves into a box plot (the Edgeworth box) to illustrate the simplest scenario of two interacting individuals in a closed system of resources [6] (Figures 6-8).

Figure 6: Graphically, the Edgeworth box is formed by rotating the indifference curves plot of the second individual (B) by 90° and joining it with the indifference curves plot of the first individual A.

Figure 7: Formation of the Edgeworth box. Note here that any combination of Good X and Y indifferent for individual B will be a complement set of what is indifferent to A. Note here the indifference curves for the two individuals may intersect each other or, touch each other tangentially.

Figure 8: Edgeworth box showing utility curves of individuals A and B with possible intersection and tangential contact. (F,G and H) The green shaded area produced by intersecting utility curves (UA4 of individual A and UB1 of individual B) indicates all possible utility combinations that are inefficient (Pareto- inefficient) which can be improved to the advantages of both individual A and B. (Pareto improvement) At the tangential points F,G and H, the sets of utilities for both A and B are at the optimal combination, such that any deviation from points F,G or H will fail to benefit one individual without sacrificing the other, hence called “Pareto efficient” or “Pareto optimal” points. The best fitting line joining these points will form the “contract curve” indicating optimal transaction between A and B (in orange).
The Edgeworth box reveals scenarios where utility combinations can be varied to each party’s benefits (Pareto improvements) or, where any attempt to increment one party will invariably decrement the other party (thereby a Pareto optimal/efficient state). The idea is to transact upon these Pareto optima and maintain the best economic exchange of utility (i.e., contract). The doctrine of Pareto efficiency has remained one of the kernels of modern economics, significantly impacting the theories and processes of decision-making [7].
That said, in reality, re-allocation of resources from an inefficient state to an efficient state is not always a Pareto improvement (i.e., entailing extra compensations and incentives to the suffering parties), nor does Pareto efficiency guarantee social and welfare equity in a multi-agent society without a prior assumptions [8]. This leads to the Kaldor-Hicks concept which is widely used in welfare economics, stating that for any re- allocation or intervention, an outcome is still considered more efficient when parties that are incremented can in theory compensate those parties that are made worse, irrespective of whether the compensations are actually executed [9].
Economic efficiency and rationale of economic evaluation
Combining the above principles of supply versus demand, costs versus utility, Edgeworth’s indifference versus Pareto optimality, the concept of economic efficiency instantly becomes apparent. An economy is considered efficient when all possible inputs have been channeled into producing maximum outputs at the lowest costs (productive efficiency), and scarce resources have been re-allocated to cater for optimal utilities of individuals as per Pareto’s (ideal case) or Kaldor-Hick’s criteria (less ideal but pragmatic case). Resources re-allocation is always challenging when multiple alternatives abound and, each decision carries a different consequence and opportunity costs. Hence, economists conceptualise the mandate of economic evaluation (EE): a standardized method to analyse and compare the costs of a decision (and its alternatives) against the actual (or projected) benefits to determine if the intended choice is most cost-efficient. The first economic evaluation was accredited to Jules Dupuit who evaluated the costs for implementing public works as compared to the benefits that could be recouped , which also blueprinted the first cost-benefit analysis (CBA) [4]. Later on, other variants of CBA evolved when outcomes of effectiveness and utility are adopted instead of dollars, namely cost-effectiveness analysis (CEA) and cost-utility analysis (CUA). These three cardinal EE tools (CBA, CEA and CUA) all share one rationale—to enable planning and decisions of private and public interventions (or policies) at maximum economic efficiency (i.e. Pareto optimality) and best equities of all parties where possible.
Cost-benefit analysis (CBA)
CBA is a systematic process to evaluate and compare the input costs and output benefit of an action (or intention) in order to see if it is worth doing, using monetary terms as a common denominator. If net benefits outweigh costs, it is considered worthwhile. For comparing multiple alternatives, the benefit cost ratio (BCR) is often used where:
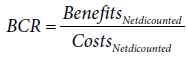
Here, the magnitude of BCR for each alternative can enable ranking. The main advantage of CBA lies in the use of dollars as the unit of analysis, which is universally understood and welcome by all decision makers and policy stakeholders. CBA was widely adopted by Governments and federal agencies and became the reference EE tool in public works policies up to our present day [10-13].
The US Army Corps of Engineers still claim themselves as founder and avid performer of CBA (and BCR) since its first use in 1936 for floods control [14]. CBA debuted on the stage of healthcare in 1960’s when Burton Weisbrod adopted the human-capital approach to evaluate the economic benefits in treating cancer, TB and polio versus the costs needed [15]. However, the necessity for decision-makers to assign a money value to measure outcomes in CBA soon led to severe criticisms from ethicists and welfarists, and this remained the major shortcoming of CBA, amongst other pre-requisite principles as enunciated in Circular A-94 of the US Office of Management and Budget [16]. To circumvent this, the idea of “willingness to pay” (WTP) was advocated. WTP refers to the maximum monetary amount an individual is willing to obtain a good/service or, to avoid an undesirable event, and such value is accrued by survey or consensus [17-19].
Proponents of WTP posit that despite the use of monetary value as a measure outcome, WTP is derived from the perspectives of endusers and hence is ethical and logical. Since the first mention of WTP in healthcare context in 1977, it became so popular that WTP-related PubMed publications have increased 23-fold from 1990 to 2013. Examples of published studies using CBA and WTP are given [20,21] (Table 1).
| Study | Use of WTP | Nature of study | Conclusion |
|---|---|---|---|
| Sanghera et al (58) | Symptoms improvement | Comparing 2 treatments for menorrhagia | WTP approach is a feasible alternative to health questionnaires to capture benefits |
| Keith et al (59) | Symptoms avoidance | Comparing 2 delivery modes of intra-nasal steroids | WTP enables discriminative analyses between the two treatments |
| Greenspoon et al(60) | Societal Benefits | Comparing 2 different methods of radiosurgery for brain metastases | WTP enables comparison of benefits two choices in terms of societal benefits |
| Iskedjian et al(61) | Societal Benefits | Exploring potential injection for opioid-induced constipation in terminal patients | WTP enables CBA to provide economic analysis for its feasibility |
Table 1: Published CBA studies using WTP.
However, use of WTP is not exclusively to CBA: it serves equally well in CEA and in particular, derivation of QALYs and DALYs for CUA (vide infra). That said, varying methodologies (e.g., bidding game, surveys, consensus) and potentially conflicting perspectives (societal versus private insurance, policy holders versus patient-advocates) in deriving WTP have led to its highly variable estimation, such that health economists have remained skeptical of the validity of WTP, if not insisting on an outright rejection [22,23].
Cost-Effectiveness Analysis (CEA)
Cost-effectiveness analysis(CEA) refers to a systematic comparative analysis of input(costs) per standardized unit of non-monetary outcome measure for two or more interventions [24]. In healthcare, the concept of CEA was first proposed by Weinstein and Stason in 1977 [25]. The units of effectiveness measure in CEA can be : number of successful cases treated, number of cases screened or prevented, number of lives saved or number of life years gained [26-33]. For ease of comparing and ranking more than two alternatives in CEA, the notion of costeffectiveness ratio (CER) has been adopted [34,35].
Mathematically,
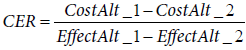
where Cost Alt_1 and Cost Alt_2 are the net (discounted) costs of alternatives 1 and 2,
and EffectAlt_1 and EffectAlt_2 are the net (discounted) effects from alternatives 1
and CER is considered necessary only when both of the following are satisfied, namely:


it will be a straight-forward decision to accept, and vice versa,

It will be a straight-forward case to reject. Alternatively, for any one given choice, economists would like to know the extra costs needed to gain an increment of the effectiveness measure, and hence the incremental cost-effectiveness ratio (ICER) is derived as an alternative way for comparing various choices:
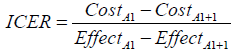
Where Cost A1 and Cost A1+1 are the net costs of a single choice at an initial form A1 and at form A1+1 having an incremental effectiveness, and EffectA1 and EffectA1+1 are the net effectiveness of the choice at the initial (A1) and incremented forms (A1+1.)
Apart from comparing alternatives, ICER can be used to evaluate cost-effectiveness for an existing treatment or health policy with known efficacy but for a different scenario, e.g., use of herpes zoster vaccine for adults aged over 50 instead of 60 [36].
In our history of medicine, perhaps one of the most important applications of CEA is for advocating oral rehydration therapy (ORT) for decreasing the morbidity and mortality of diarrheal diseases in developing countries, given a ICER of as low as US$4 per case treated [37,38]. Despite its major advantage in using a non-monetary unit as effectiveness measure, CEA still suffers from several limitations:
i) The health-related measure may not be clinically meaningful, e.g., what does 10mmHg drop in blood pressure or, 0.5 mmol/ dL reduction of serum cholesterol really translate to human health or overall longevity?
ii) Number of years lived do not equate or guarantee quality of life lived.
iii) Lives saved and life-years gained may differ in true value at different spectrum of life, i.e., pediatric versus geriatric patients.
iv) Cannot be used in comparing interventions effectiveness based upon different platforms, e.g., education versus chronic diseases versus communicable diseases.
Cost-Utility Analysis (CUA)
Cost-utility analysis (CUA) is a form of cost-effectiveness analysis where the effectiveness measure incorporates both the time factor and utility (or disutility), namely, Quality-Adjusted-Life-Year (QALY) or Disability-Adjusted-Life-Year (DALY). The concept was first published by Klarman et al when he compared the quality of life of patients who had kidney transplantation with patients on renal dialysis, and stated that transplant patients “enjoyed a differential in the quality of life as quantified as a fraction of each life-year gained” [39]. As utility refers to the preference and satisfaction of consumers, in healthcare context, CUA becomes a preferred tool to evaluate interventions or policies that affect the overall health, as expressed as QALY or DALY. For QALY, it is a product of the life years gained x utility/disutility ratio (an arbitrary number from 0=death to 1=perfect health) and is expressed as perfect life-years gained. DALY is derived in the same way except that the scale is reversed (0=perfect health and 1=death), and is expressed as disabled lived years averted. If a treatment can help a patient who is supposed to die within 1 year at a utility of 0.3 (30% of his perfect health), and instead allowing him 4 more years to live at 60% capacity (utility ratio 0.6), the undiscounted gain for this treatment will be 0.6x4-0.3x1=2.1 QALYs. Similarly, if a treatment can alleviate a patient’s disability from 50% over 10 years to 20% over 10 years, the undiscounted DALYs averted will be 0.5x10 – 0.2 x 10 = 3 DALYs . If this treatment costs $120,000, its cost-effectiveness ratio (CER) will be $57142 per QALY. While QALYs are often employed for life-saving measures, DALYs are adopted in evaluating interventions that alleviate chronic disability and suffering e.g., new orthogeriatric model of care for rehabilitation of hip fractures, or acupuncture for treating chronic low back pain [40]. It is worth noting that QALYs and DALYs are not interchangeable as there is a subtle difference between Quality of Life and Disability [41]. In fact, any health intervention will return a different set of QALYs /DALYs dependent on the age of patients, duration of illness, prognosis of diseases, weighting for quality of life versus disability. However, QALY and DALY are not mutually exclusive as different tools will be used to assess the quality/disability of life; e.g., in a study by Mihalopoulous et al looking at three options of treatment for post-traumatic stress syndrome (PTSD), both QALYs and DALYs were calculated for each option, with the conclusion that trauma-focused cognitive behaviour therapy (TFCBT) will positively benefit PTSD in both adults and children [42,43]. Another example of CUA is a recent evaluation of NHS breast screening programme by mammography in UK for women aged over 50, which yielded a value of £20,800 per QALY gained - this marginally satisfied the criteria of cost-effectiveness in 45% of scenarios, calling for a need to revise the national mammography screening policy. That said, the exact benchmark value for a cost-effective QALY gain (or DALY averted) is controversial. Since 2002, World Health Organisation (WHO) defined the threshold value of a cost-effective DALY averted as less than 3 times the gross domestic product(GDP) per capita of the country, and, if less than 1 GDP, it is considered very cost-effective [44]. Most studies derive threshold costs of QALYs by the WTP method, and hence the value inevitably varied depending on the societal perspectives [45,46]. In USA, the consensus threshold for cost-effectiveness had been $50,000 per QALY gained as derived from care of chronic renal diseases in 2000, but was soon revised to $150,000 [47,48]. A recent meta-analysis also reported the thresholds of QALY gained by WTP method ranged from $2019 to $282,821, an astounding 140 fold difference. Due to variable methodologies and questionable contexts of QALY/DALY derivation with potentially flawed assumptions, economists are still in dissention as to the validity and future of QALY/DALY [49,50].
Role of sensitivity analysis
When applying any EE for decision making, one wants to know how robust the process and how valid the data are in view of the intrinsic uncertainties and variability of the parameters [51]. To address this issue, sensitivity analysis is routinely performed before enacting upon the conclusion of any EE. Traditionally, when parameters of an EE interact in a known way, they can be varied either individually or in multiples to perform such sensitivity analyses, hence known as univariate or multivariate deterministic analysis respectively. More often than not, the degree and nature of interactions between different parameters are unknown and hence probabilistic statistical methods (Bayesian) have to be employed to achieve a more robust validation (probabilistic sensitivity analysis). Further discussion is beyond the scope of this article, and interested readers are referred to discussion papers by Briggs and Baio et al [52,53].
When applied in evaluation of healthcare, all three EE (CBA, CEA and CUA) become important tools of health economic evaluation (HEE). An example for using each tool in general practice setting will be quoted to illustrate the case. For treatment of hypertension, often angiotensin receptor blockers (ARB) are used but they carry different therapeutic efficacy with a different price tag. Belsey used CBA to compare two ARBS head-to-head and concluded that, olmesartan is superior to candesartan as olmesartan reached target blood pressure quicker and hence save overall costs of treatment [54]. In general practice, it is a known fact that screening for colorectal cancer (CRC) screening using the fecal occult blood test (FOBT) often, if not always, yields a low response. A randomized controlled trial by Lee et al employed cost-effective analysis to demonstrate that a simple mailed reminder to patients is cost-effective in enhancing CRC screening rate with an ICER of US$15 per additional patient screened [55]. In USA, Wielage et al applied CUA in evaluating duloxetine for treating osteoarthritis and concluded that the cost-effectiveness of duloxetine only marginally exceeds NSAIDs overall , yet remarkably excels in populations over 65 yrs and for those at risks of NSAIDs-related adverse effects [56].
As our human civilisation progresses though anarchism, monarchism, totalitarianism to egalitarianism, scarce resources/ services have to be re-allocated among individuals in the most efficient and equitable fashion in order to maintain societal viability and stability. To achieve this, economic evaluation (EE) becomes a mandate, of which there are three possible tools: CBA, CEA and CUA. When applied in healthcare, EE faces a major ontological challenge of human health and life, plus epistemological disputes for their valuations. The advocates of WTP and subsequent QALY/DALY calculations have quietened the debate transiently. Yet, when methodologies for estimating WTP and QALY/DALY diversify and yield differing outcomes, the original dilemma in HEE have come back to full circle. Nevertheless, different HEE tools appeal to different decision makers at various levels, and in real life they are used in various combinations with no mutual exclusions (Figure 9).

Figure 9: Different HEE tools adopted by different countries, often in combinations. Taken from Riedel R, Repschlager U, Griebenow R, et al. International standards for health economic evaluation with a focus on the German approach)[62].
As illustrated by the Centers of Diseases Control and Prevention (CDC), at government and national levels, CBA comparing outcomes interms of dollars will enable the President to arbitrate the national budget between healthcare, welfare, defense and infrastructures; at the provincial levels, CUA showing different outcomes of population health can guide the Public Health Director to channel resources into various disease prevention initiatives. Finally, at the local hospital or clinic level, CEA showing number of cases diagnosed will justify the choice of the best glaucoma screening program [57-63]. That said, all HEE are prone to various uncertainties and should be subjected to appropriate sensitivity analysis before conclusions can be drawn.
Take home messages:
• Medical resources are scarce and needed to be allocated to meet an ever-increasing demand
• Decision makers and policy stakeholders in healthcare are responsible to ensure such allocations are efficient and equitable in the best interests of the end-users
• Economic efficiency is achieved when all inputs are used to maximum outputs at the lowest costs, and scarce resources have been re-allocated to fulfill supply-demand of individuals at optimal utilities.
• Pareto efficiency is the gold standard for economic efficiency but in real-life some criteria and modifications are applied (Kaldor-Hicks criteria and compensation)
• The three main economic evaluation tools are cost-benefit analysis (CBA), cost-effectiveness analysis (CEA) and costutility analysis (CUA)
• CBA use monetary terms for outcome measures and are easily understood and adopted by healthcare decision makers
• CEA and CUA use non-monetary measures that reflect health status and quality of life (QALY and DALY).
• Due to differing perspectives and evaluation methods, the thresholds for QALY/DALY can vary widely and poses logistic issues during cross-comparison
• All HEE are prone to uncertainties and should be subjected to appropriate sensitivity analyses before decision-making
