Research - (2021) Volume 7, Issue 2
Background: Iran has made great achievements in Health Sector and health financing after the implementation of the Health Sector Evolution Plan; however, there are still some provinces and expenditure groups that suffered from health payments and faced CHE. This study aimed to compare the rates of households with CHE, further to explore the different performance of factors influencing CHE before and after the HSEP in Iran.
Method: statistical data were acquired from two surveys conducted by Iran statistic Centre (2012 and 2015). A total of 18500 households in 2012 and 17649 households in 2015 were included in this study. The indices of FFC, CHE, Overshoot, and Mean Positive Overshoot are calculated to measure the fairness of financial contribution, intensity, and prevalence of catastrophic health payments.
Results: The overall measure of FFC was 0.869 and 0.909 in 2012 and 2015, respectively. The overall rate of households facing CHE reduced significantly to 0.28% just one year after the implementation of HSEP in Iran. The overshoot of CHE was 0.15% in 2012 and 0.37% in 2015, generally. Meanwhile, MPO is ranged from 12.139% to 13.119% over the threshold in 2012 and 2015, respectively. The findings revealed that the number of members with illiterate householders and the number of outpatients in households are the risk factors for CHE in both years. Besides, households with elderly members in 2012; and households with a number of members more than 5 in 2015 are more likely to experience the risk of CHE.
Conclusion: The Iranian government should pay more attention to the actual conditions in different provinces, further to make policy decisions according to the local knowledge. It is necessary to improve economic development, expand literacy and employment, and adjust policies to make greater efforts to protect outpatients, and inpatients, further to reduce the risk of CHE.
Catastrophic health care expenditure • Out-of-pocket payment • Health sector evolution plan • Iran
The burden of health costs and the economic effect on households depend on the country’s health system and the ability of out-of-pocket (OOP) expenditure of households [1]. Protecting the population against the financial risks associated with ill health is one of the fundamental objectives of the health systems [2]. The fairness of health financing is also a subset of the three main goals of health systems; good health, responsiveness, and fairness of financial contribution (FFC). Fairness in financial contribution and protection against financial risk is based on the notion that every household should pay a fair share. What constitutes a fair share depends on people’s normative expectations as to how health systems are financed [3]. In practical terms, embedding these notions of fairness in financing is a step towards preventing the catastrophic expenditure of households when one of the members becomes ill [3]. In fact, it had estimated that approximately 150 million people globally are facing catastrophic expenditure annually because of high payments for health services [4]. Catastrophic health expenditure (CHE) is defined as OOP expenditure equaling to or exceeding 40% of household capacity to pay [5]. OOP expenditure and CHE are barriers to achieve universal health coverage [6], in which all people can obtain the health services they need without suffering financial hardship [7].
The expansion of primary healthcare (PHC) in Iran in 1980s was mainly based on the principles of health for all as introduced in the conference of Alma-Ata [8]. The PHC network considerably improved health outcomes [9], however, it was not adequate to meet emerging health needs of the population after a few decades. Also, expansion of services to urban and suburban areas and dynamics of patients’ referral path were always challenging [10]. Since 2005, the family physician program, an updated referral path system and a reform package toward universal health insurance started in rural areas and small towns; they were later expanded by the following governments [11]. For instance, in the fourth national socio-economic development program, it was the first time that they focused on FFC Index and confirmed that it should be increased over 90 percent, moreover out-of-pocket payments should decrease under 30 percent in that period [12]. This articles were emphasized in the fifth national development plan as well [12]. In spite of some achievements in some fundamental indices, such as the rate of maternal mortality, the under five-year mortality and the life expectancy of women and men [13], increasing population coverage of health insurance, there were still several known issues in access to healthcare and equity of financing and utilization [8,14,15]. The 11th government, elected in June 2013, launched series of reforms in 2014 to respond to some of the known issues in the performance of health system. The changes, so-called Health Sector Evolution Plan (HSEP) or Health Transformation Plan, were designed by the Ministry of Health and Medical Education (MOHME) based on the fifth 5-years national development plan [16] and aimed to improve the following areas: notable percentage of uninsured individuals (around 17% in 2010) [17-19], inequitable health financing with a fair financing contribution index (FFCI) of 0.832, OOP payments of more than 50% and around 2.5% catastrophic payments [8,16,20-23] and even more pessimistic estimates for FFCI and catastrophic payments in local studies [24,25]. Also, there is evidence of high amounts of informal payments [26]. Employer-sponsored health insurance systems in Iran were not able to equally protect people from catastrophic payments [22]. On the other hand, previous interventions such as the Urban Inpatient Insurance Scheme (launched in 2000) and the Rural Health Insurance Scheme (launched in 2005) had regressive impacts on the distribution of healthcare financing in Iran [27,28].
Recently, considerable literature has emerged around the theme of health reform, CHE, FFC and analyzing the effects of socio-economic factors on CHE. Hengjin Dong et al. (2018), checked the catastrophic health expenditures in Zhejiang and Qinghai provinces in China. Univariate and multivariate logistic regression analyses were also used to identify the performance of factors of CHE. The results showed that the average rates of CHE in Zhejiang and Qinghai were 9.6 and 30.5%, respectively. They also found that economic status of households and households headed by an employed person are the protective factors for CHE; and number of members with chronic diseases and number of inpatients in household are the risk factors for CHE [29].
Esso-Hanam Atake and Djesika D. Amendah (2018), in the study of “Porous safety net: catastrophic health expenditure and its determinants among insured households in Togo” examined the extent to which Togo’s NHIS (National Health Insurance Scheme) protects its members financially against the consequences of ill-health. At the 40% threshold, health care cost represents 60.95% of insured households’ total monthly non-food expenditure.
This study showed that the socioeconomic status, the type of health facility used, hospitalization and household size were the highest predictors of CHE [30].
Merita Berisha et al. (1989) measured the level of financial risk protection through two commonly applied concepts: catastrophic health expenditures and impoverishment. They found that approximately 80% of the households in Kosovo incurred OOP health payments. Most of these expenditures were for medicine, pharmaceutical products and medical devices, followed by diagnostic and outpatient services. Hospital services and treatment abroad were less frequent but highly costly. Although households from the upper consumption groups spent more, households from the lower consumption groups spent a greater share of their consumption expenditures on healthcare [31].
Yazdi-Feyzabadi et al. (2018) showed that an increasing number of Iranians has been subject to catastrophic health care costs over the study period in both rural and urban areas (CHE=2.57% in 2008 and 3.25% in 2015). In the same period, the overshoot of CHE and the mean positive overshoot ranged from 0.26% to 0.65% and from 12.26% to 20.86%, respectively. The average absolute monetary value of OOP spending per month has been low in rural areas over the years, but the prevalence of CHE has been higher than urban areas. Generally put rural settlement, higher income, receiving inpatient and outpatient services, and existence of elderly people in the household led to increase in CHE prevalence (p<0.05). Interestingly, provinces with more limited geographical and cultural accessibility had the lowest CHE [32].
Ghobad Moradi et al measured Catastrophic Health Expenditure after the Implementation of Health Sector Evolution Plan [33]. They found that the households without supplementary insurance (OR=0.05) as well as those with females as household heads (OR=0.09) experienced a greater likelihood of facing CHE. As for the variable related to receiving hospital inpatient services, those households receiving inpatient services had the chance of facing CHE 129.7 times more than other households. In addition, the chances of exposure to CHE in the households with members aged over 65 or members with disabilities and in need of care or in the households taking rehabilitation and dental care services were, respectively, 4.51, 5.21, 2.91, and 6.77 times more than other households. As for the economic status variable, the chance of facing CHE in households with low economic status (the poor) was 19.04 times more than the middle class and the rich. (It should be noted that the economic status variable initially consisted of three categories of poor, middle, and rich; but, the middle class and the rich were later merged into one category).
All of these studies are similar in the base and every one of them tried to represent the status of households which are at the risk of facing CHE in some selected provinces and income groups. But the point here is that, there is no paper in Iran to analyze the effects of Implementation of Health Sector Evolution Plan on health care payments comprehensively.
Therefore, the present study evaluated the extent to HSEP achieved its objectives by assessing the catastrophic health expenditure (CHE) and Fairness in Financial Contribution Index in five income quintiles and nine different regions of urban areas before and after the implementation of the plan in 2012 and 2015, respectively. Such research on urban differences and across provinces can help policy makers specify interventions and improve the CHE by focusing on at risk settings and improving equity in financial accessibility through filling gap between areas. Additionally, this study is aimed to estimate the prevalence and intensity of households’ exposure to CHE in urban areas in Iran, and determine household characteristics effects on CHE [34].
To investigate the intensity and the prevalence of CHE in the financing of health spending before and after the implementation of the HSEP in Iran, the “catastrophic health expenditure”, “overshoot” and “mean positive overshoot” are examined. In addition to that, we measured the FFC index to compare the situations of fairness in financial contribution. Required data were obtained from two national repeated cross-sectional surveys on annual income and expenditure surveys. These surveys are annually run by Iran Statistics Center (ISC). These surveys include 1) social characteristics of household members; 2) housing characteristics, living facilities, and assets; 3) household food and non-food expenditures; and 4) household income [32].
In this study, the household expenditure data is used as a substitute of the actual amount of household income and the calculation domain is not limited to the whole country, but also being investigated for the expenditure quintiles and geographical regions of the Iranian households. Separation by quintiles and regions provides a better understanding of the inequalities in detail. The method proposed by WHO was used to calculate the CHE and FFC annually. In this method, financial catastrophe occurs when household’s OOP spending equals or exceeds 40% of its capacity to pay (CTP) [3]. In order to measure CHE, one should firstly calculate households’ capacity to pay, as “the effective income (total household expenditure) minus the basic living needs (subsistence spending) adjusted for household size”. Simply put, CTP equals households’ non-food expenditure [4].
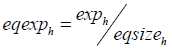
Given the economy scale of household consumption, equivalence scale was used instead of actual household size in CTP calculation:
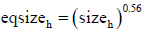
Where “ sizeh ” is actual household size and eqsizeh is equivalence size of the household. Based on a similar study on 59 countries, β was considered to be 0.56 [4].
One also needs to calculate poverty line (PL), which is a minimum spending to protect the basic needs (i.e. subsistence spending). The PL was calculated based on households’ food share. For this end, mean of absolute food expenditure was calculated for households whose food share of total household expenditure ranged from 45 to 55%. The PL was separately measured for households as shown below:
food45 < foodexph < food55
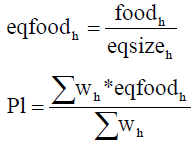
Where Wh is sampling weight of households and p1stands for poverty line.
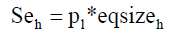
Moreover, subsistence spending of household (seh) was calculated as:
Some households reported that their food expenditure was lower than subsistence spending seh (>) foodh. This could be due to the fact that reported food expenditure in surveys did not consider food subsidies, coupons, self-production, and other non-cash means of food consumption. In situations like this, the food expenditure is lower than the estimated poverty standard for that country, so the CTP or household non-subsistence spending equals [3]:
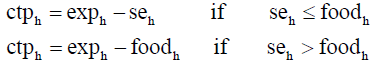
Where ctph is CTP and exph is the total expenditure. Then the OOP (payment for health at the point of service delivery) is divided by CTP and is called as “burden of household health payments”. It is calculated as follows:
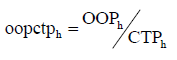
Then, if the above equation is greater than or equal to 0.4 (if oopctph ≥ 0.4), the household experience CHE.
The percentage of households experiencing catastrophic payments, named as catastrophic head count (HC), is estimated as follows:
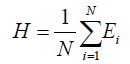
Where N equals the sample size. Regarding E, If OOP of household i is equal or greater than the threshold, E=1; otherwise, it equals zero. HC measures the proportion of households whose OOP is above the threshold, but it does not measure the degree by which payments exceed the threshold. The intensity of CHE is calculated using two measures including overshoot and mean positive overshoot (MPO) measures. Overshoot shows the average degree by which OOP payments exceed the threshold (Z). The threshold in this article is 0.4. Thus overshoot gives an indication of how much OOP payments exceed the threshold (i.e. 0.4). The overshoot was calculated based on the following formula [35]:
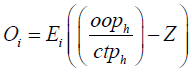
Then, a household is said to have experienced catastrophic payments when  exceeds the threshold. The average overshoot is [35]
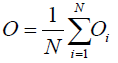
Another measures used to calculate intensity of CHE is MPO which means the payment in excess of the threshold, averaged over all households exceeding that threshold. Thus, MPO is the overshoot divided by HC [35]

To allow for comparisons, the distribution of household financial contribution across households has been summarized using an index called Fairness of Financial Contribution (FFC). This index is designed to weigh heavily those households that have spent a very large share of their beyond subsistence effective income on health. The index thus reflects overall inequality in household financial contribution into the health system, but particularly reflects those households facing catastrophic health expenditure.
The FFC is based on the mean of the cubed absolute difference between oopctp a given household oopctp norm. The index is of the form:
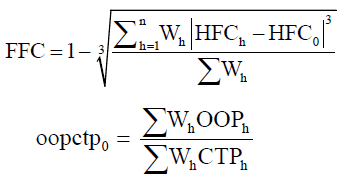
The FFC ranges between 0 and 1. The fairer the health financing system, the closer FFC will be to 1 [3].
The expenditure quintile is ranked by equivalized per capita household expenditure (eq exph). [3]
We also examined that what factors may affect CHE. Thus, we used a binary outcome variable (with value 1 indicating a household with catastrophic expenditure, and 0 without catastrophic expenditure). Independent variables were selected on the criteria of the frequency. Thus, socio-demographic characteristics that were used to investigate the associated of CHE were as follows: number of household members, one or more member older than 60 years, one or more member younger than 5 years, hospitalized person in household, household using outpatient care, geographical regions, expenditure’s quintiles, householder’s gender, education, and employment status.
To convert Rial (Iran’s currency) to international dollar (PPP), American dollar (USD) exchange rate was first obtained from the Central Bank of Iran for each year1 [36]. Then, PPP conversion factor2 was obtained from the World Bank [37] and the equivalence of 1 PPP in terms of Iran’s Rial was estimated for each year3.
The prevalence of CHE, its overshoot, and MPO were separately calculated for different regions and quintiles. The confidence interval (CI) was also reported for CHE prevalence in this study.
To examine factors affecting the CHE, as a binary outcome variable, we should use a logistic regression model. Then, we used a logistic random effects regression model to report the effects of variables and 95% confidence intervals for odds ratios are reported. The effects of government policies and programs in HSEP were compared using softwares EXCEL and STATA13. We displayed the variation of CHE disparities across provinces by quintile of provinces from first to fifth quintile (i.e. each quintile shows one fifth of the total number of provinces). The analyses were done at household level. Sampling weight, resulting from the method of sampling, was entered into all analyses.
Provincial disaggregation is done as follows:
Region one: East Azerbaijan, west Azerbaijan, Ardabil
Region two: Gilan and Mazandaran
Region three: Golestan, Semnan, Razavi Khorasan, North Khorasan
Region four: South Khorasan, Sistan and Baluchestan, Kerman, Hormozgan
Region five: Tehran and Alborz
Region six: Qom, Qazvin, Markazi
Region seven: Isfahan, Yazd, Fars
Region eight: Bushehr, Chahar Mahaal and Bakhtiari, Kohgiluyeh and Boyer-Ahmad, Khuzestan
Region nine: Lorestan, Hamadan, Ilam, Kermanshah, Zanjan
A total of 18500 households in 2012 and 17649 households in 2015 were included in this study 115774-Heor-20-22109. According to Table 1, the rates of CHE in both years in urban areas were between 1.22% and 0.28% in 2012 and 2015, respectively. Compared with households in geographical regions, the first region has faced the highest rate of CHE (1.73) in 2012, and the third region has faced the highest rate of CHE (0.41) in 2015. It is also essential to mention that, the fifth quintile experienced the highest percent of CHE in both years (2.94 and 0.70) among expenditure’s groups. Households with members older than 60 and female householders were in danger of CHE much more than others in both years. Also, household with hospitalized and outpatient care in 2012 faced catastrophic health expenditures at approximately 2% in 2012, however, just 0.2% of people experienced this in 2015 (Figure 1).
| Household characteristics | Households | Households with CHE | ||
|---|---|---|---|---|
| 2012 (n=18500) |
2015 (n=17649) |
2012 (n=231) |
2015 (n=50) |
|
| Household with CHE, n (%) | 230 (1.221) | 50 (0.28) | - | - |
| Number of outpatients in household | 4936 (26.63) | 4301 (24.37) | 108 (2.18) | 10 (0.23) |
| Number of hospitalized in household | 528 (2.84) | 653 (3.70) | 12 (2.09) | 0 |
| Number of household members (≥ 5), n (%) | 5031 (27.33) | 3800 (21.53) | 64 (1.26) | 4 (0.11) |
| Number of households with one or more members older than 60 years, n (%) | 3812 (20.70) | 2697 (15.28) | 64 (1.64) | 9 (0.33) |
| Number of households with one or more members younger than 5 years, n (%) | 1054 (5.69) | 1299 (7.36) | 14 (1.33) | 3 (0.23) |
| Regions | ||||
| Number of households in first region, n (%) | 1737 (9.37) | 1618 (9.16) | 30 (1.73) | 3 (0.18) |
| Number of households in second region, n (%) | 1119 (6.03) | 977 (5.53) | 18 (1.61) | 1 (0.10) |
| Number of households in third region, n (%) | 2575 (13.89) | 2447 (13.86) | 27 (1.05) | 10 (0.41) |
| Number of households in forth region, n (%) | 2497 (13.47) | 2302 (13.04) | 20 (0.80) | 9 (0.39) |
| Number of households in fifth region, n (%) | 1880 (10.14) | 1904 (10.78) | 19 (1.01) | 8 (0.42) |
| Number of households in sixth region, n (%) | 1492 (8.05) | 1474 (8.35) | 22 (1.47) | 2 (0.14) |
| Number of households in seventh region, n (%) | 1902 (10.26) | 1870 (10.59) | 32 (1.68) | 6 (0.32) |
| Number of households in eighth region, n (%) | 2178 (11.75) | 2091 (11.84) | 21 (0.96) | 4 (0.19) |
| Number of households in ninth region, n (%) | 3120 (16.83) | 2966 (16.80) | 41 (1.31) | 7 (0.23) |
| Quintiles | ||||
| Number of households in first quintile, n (%) | 3700 (19.96) | 3530 (19.99) | 21 (0.57) | 3 (0.08) |
| Number of households in second quintile, n (%) | 3700 (19.96) | 3530 (19.99) | 18 (0.49) | 6 (0.17) |
| Number of households in third quintile, n (%) | 3700 (19.96) | 3530 (19.99) | 21 (0.57) | 6 (0.17) |
| Number of households in forth quintile, n (%) | 3700 (19.96) | 3530 (19.99) | 50 (1.35) | 10 (0.28) |
| Number of households in fifth quintile, n (%) | 3700(19.96) | 3529 (19.99) | 109 (2.94) | 25 (0.70) |
| Female household head, n (%) | 2350 (12.82) | 2165 (12.21) | 30 (1.27) | 11 (0.51) |
| Married household head, n (%) | 15842 (85.47) | 15215 (86.16) | 191 (1.20) | 39 (0.26) |
| Educated household head, n (%) | 14549 (78.49) | 14320 (81.13) | 166 (1.14) | 34 (0.24) |
| Employed household head, n (%) | 11881 (64.10) | 11451 (64.88) | 127 (1.07) | 23 (0.20) |
Table 1: Household characteristics in 2012 and 2015.

Figure 1: The trend of PL before and after implementation of HSEP in five quintiles and nine regions.
It is also clear that, generally, the rates of CHE decreased significantly after the implementation of HSEP in Iran.
As it is clear in Figure 1, the poverty line of households in fifth quintiles is by far more than others. It was fluctuated between $5351352 and $14700000 in 2012, and then they were decreased to $4532578 and $11700000 in 2015 for first and fifth quintiles, mean while, other quintiles were fluctuated some where between them. First ($11400000) and eighth ($9182214) regions faced higher PL in comparison with others (Figure 2).

Figure 2: The trend of CTP before and after implementation of HSEP in five quintiles and nine regions.
Figure 2 considered on capacity of households to pay for their health stuffs. It was not changed considerably after the implementation of HSEP. Households in the fifth region and fifth quintile had better situation in comparison with other households in both years. What I mean is that, they had higher capacity to pay for their health payments (Figure 3).

Figure 3: The trend of CHE index before and after implementation of HSEP in five quintiles and nine regions.
Figure 3 revealed that, households in first and fifth quintiles in both years, second region in 2012 and ninth region in 2015 faced the highest percent of CHE. It is clear enough to realize that the HSEP had a significant and successful effect on CHE in 2015, however, the fifth quintile still experienced the highest rate of CHE (Figure 4).

Figure 4: The trend of FFC index before and after implementation of HSEP in five quintiles and nine regions.
According to Figure 4, the trend of inequality fluctuated between 0.78 and 0.95, mostly. However, in some regions it is reached to the higher than 0.95 in 2015 which shows that HSEP affected this index, considerably (Figure 5).

Figure 5: The prevalence of CHE before and after implementation of HSEP in five quintiles and nine regions.
As shown in Figure 5, the intensity of CHE (the ‘overshoot’ at 40% threshold) ranged from zero to 0.968% in 2012 and from zero% to 0.23% in 2015. Generally, the overshoot had decreased after the implementation of HSEP. However, in terms of MPO (expenditure beyond the threshold), these rates for the households that actually experienced catastrophe at 40% threshold ranged from 0% to 21.585% in 2012 and from 0% to 46.771% in 2015 which had increased after HSEP (Figure 6).

Figure 6: The prevalence of CHE (mean positive overshoot) before and after implementation of HSEP in five quintiles and nine regions.
Table 2 shows determinants of catastrophic health expenditure (CHE) prevalence were assessed by a multivariable logistic random effects regression model. The results showed that in 2012, there was significant relationship between CHE experience and household income groups (fifth quintile), literacy of householder, experience of outpatient healthcare, and presence of elder lies (older than 60 years) living in the household (p<0.05). There was also significant relationship between CHE and household expenditure groups (fourth and fifth quintiles), experience of outpatient health care, literacy of householder in 2015. Interestingly, there were no significant relationship between CHE experience and gender, the situation of employment of house holders and the geographical regions (p>0.05) (Table 2).
| Variable | Year/ adjusted OR (95% CI) | |||
|---|---|---|---|---|
| 2012 | P-value | 2015 | P-value | |
| Characteristics | ||||
| Number of household members | ||||
| <5 | .8113758 (.5939495 1.108395) | 0.189 | 2.768113 (.9682765 7.913495) | 0.057 |
| ≥5 | ||||
| Hospitalized person in Household | ||||
| No | 1.334318 (.7081691 2.514094) | 0.372 | 1 (omitted) | - |
| Yes | ||||
| Household using outpatient care | ||||
| No | 1.32217 (1.007174 1.735681) | 0.044 | .382157 (.1891698 .7720259) | 0.007 |
| Yes | ||||
| One or more members older than 60 years | ||||
| No | 1.629367 (1.152491 2.303562) | 0.006 | .532542 (.236504 1.199138) | 0.128 |
| Yes | ||||
| One or more members younger than 5 years | ||||
| No | 1.425963 (.812858 2.501508) | 0.216 | 1.32237 (.3963383 4.412047) | 0.649 |
| Yes | ||||
| Regions | ||||
| Region 2 | 1.026629 (.5707418 1.846662) | 0.930 | .4338933 (.0445863 4.22245) | 0.472 |
| Region 3 | .7215059 (.4200138 1.239413) | 0.237 | 3.577825 (.971015 13.18294) | 0.055 |
| Region 4 | .750337 (.4169515 1.35029) | 0.338 | 3.164986 (.8063756 12.42242) | 0.099 |
| Region 5 | .6444582 (.3486558 1.191222) | 0.161 | 1.823631 (.4711114 7.059113) | 0.384 |
| Region 6 | .9661329 (.5516468 1.692048) | 0.904 | .8880844 (.1470224 5.364447) | 0.897 |
| Region 7 | .9056404 (.5448127 1.505443) | 0.702 | 1.607229 (.3970433 6.506055) | 0.506 |
| Region 8 | .8477949 (.4801628 1.496901) | 0.569 | 1.21803 (.2698771 5.497307) | 0.798 |
| Region 9 | .8451292 (.5235875 1.364134) | 0.491 | 1.771115 (.4544982 6.901786) | 0.410 |
| Expenditure’s quintiles | ||||
| Q2 | .7946997 (.4607131 1.370804) | 0.409 | 1.861186 (.4397532 7.877172) | 0.399 |
| Q3 | .7083559 (.40682 1.233391) | 0.223 | 2.40103 (.5892161 9.784093) | 0.222 |
| Q4 | 1.520209 (.946766 2.440979) | 0.083 | 3.85732 (1.009569 14.7379) | 0.048 |
| Q5 | 2.964977 (1.91135 4.599414) | 0.000 | 10.34193 (2.939709 36.38306) | 0.000 |
| Householder’s characteristics | ||||
| Gender | ||||
| Male | .7833327 (.5044658 1.216356) | 0.277 | 1.097118 (.4861301 2.476018) | 0.823 |
| Female | ||||
| Education | ||||
| Literate | 1.582837 (1.121027 2.234891) | 0.009 | 3.025684 (1.418986 6.451621) | 0.004 |
| Illiterate | ||||
| Employment | ||||
| Employed | 1.04748 (.9201371 1.192446) | 0.483 | 1.257632 (.9638056 1.641035) | 0.091 |
| Unemployed | ||||
| Statistics | LR chi2(20) = 87.97 Prob> chi2 = 0.0000 Pseudo R2 = 0.0396 |
- | LR chi2(20) = 58.01 Prob> chi2 = 0.0000 Pseudo R2 = 0.0942 |
- |
Table 2: Determinants of CHE in 2012 and 2015, using a logistic random effects regression.
CHE reflects the economic burden of households and the financial barriers to receive health care. In our study, we aimed to measure the FFC, prevalence and intensity of CHE in 2012 and 2015 to analyze the effects of HSEP on households’ health payments in urban areas in Iran. We also explored the disparities in CHE by geographical regions and expenditure groups and revealed the factors that affect CHE prevalence.
As it can be seen in this study, the overall measure of FFC was 0.869 and 0.909 in 2012 and 2015, respectively. Taking a glance at the all measures of FFC in whole quintiles and regions showed that it had an upward trend, mostly, after the evolution plan in health sector in Iran (i.e. in the most regions, it is reached over 0.9 which was one of the main goal of the fourth and fifth development plans in Iran).
The overall rate of households facing CHE reduced significantly just one year after the implementation of HSEP in Iran. These results corroborate those of Atashbar et al. [38] and Mousavi et al. [39] who studied the situations of CHE index in Iran and showed that the measurement of this index decreased over the studied years, especially after the HSEP.
According to our findings, there was significant variation across provinces in terms of CHE rate. It may be closely related to regional economic development and healthcare demand in the all provinces. However, some counterintuitive cases of CHE rate in provinces should be examined carefully [32]. For example, the least developed provinces in fourth region (including: Sistan & Balouchestan, South Khorasan, Kerman and Hormozgan) in 2012 experienced the least rate of CHE (0.801), and most rate of FFC (0.881). The point here is that, this matter could be due to some factors outside health system, such as lower income per capita and lower education, or factors within health system, like lower geographical and cultural access to health services. These factors could limit health services utilization in these regions [40]. In addition, evidence has shown that households whom do not receive or delay health services due to geographical inaccessibility or cultural and socio-economic barriers, consequently, they will have low health costs and will be less likely to face catastrophic health expenditures [41,42]. Meanwhile, in 2015, the second region faced the least rate at approximately 0.102 in CHE and most rate of FFC (0.927). On the other hand, interestingly, some provinces which have relatively high education and income per capita and higher access to more specialized health services providers such as Fars and Isfahan (seventh region) were placed somewhere in the top half of the list of CHE (which means they experienced one of the highest rate of CHE) and the bottom half of the list of FFC (which means they faced one of the lowest rate of FFC), before and after the implementation of HSEP in Iran. In addition, some developed provinces such as Tehran, had low rate of CHE prevalence before the implementation of HSEP. Considering their huge population, the absolute number of households facing CHE is high in such provinces [32]. However, this province experienced the highest rate of CHE and the lowest rate of FFC in 2015.
According to our findings, out-of-pocket payments had decreased in urban areas after HSEP. The average OOP expenditure in urban areas in 2012 of about US $3001484 was over two times as many as those in 2015 (US $1135799), the average OOP expenditure per capita was $604500.2 and $1541357 in 2015 and 2012, respectively. The out-of-pocket payments had a slight fluctuation among different regions and quintiles but the trend has been downward (Figure 7).

Figure 7: The trend of OOP before and after implementation of HSEP in five quintiles and nine regions.
In this study, the overshoot of CHE was 0.15% in 2012 and 0.37% in 2015 (mean=0.26%), generally. Meanwhile, it is ranged from 0.086% (fourth region) to 0.249% (first region) among all regions in 2012 and ranged from 0.004% (second region) to 0.185% (first region) in 2015. It means that, on average, households spent 0.26% over the 40% catastrophic threshold. The households that actually had experienced catastrophe at 40% threshold spent 12.139% and13.119% (MPO) over the threshold in 2012 and 2015, respectively. Thus, these households spent 52.139% to 53.119% (40% threshold + MPO) of CTP on OOP. Both overshoot and MPO, as intensity measures, did have a fluctuating trend during this both years (as it is shown in figure 5 and 6). A study conducted in China [43] showed that the severity of CHE (with 40% threshold) changed from 12.57% in 2003 to 8.15% in 2013. A similar trend could be observed in MPO [43]. Another study in Iran showed that the overshoot of CHE and the mean positive overshoot ranged from 0.26% to 0.65% and from 12.26% to 20.86% in 2008 and 2015, in turn [32]. All these findings are in line with our study.
Regarding determinants of CHE, this study showed that socioeconomic status, Literacy of householders, lower income, presence of an elder member in household (older than 60), and receiving outpatient services are the main determinants of CHE.
Considering the higher proportion of poorer households’ income or consumption allocated to food, any small expenditure on health can be financially disastrous to them. It is thus difficult for the poorest of the poor to divert resources from basic needs [45]. In fact, the fifth quintile had the highest CHE and the lowest FFC in health payments. This group involves some households with high health expenditures which are not really rich, leading to increase of the inequality. This group of households may sell part of their underlying assets, and perhaps they have financed through borrowing to pay their health costs. Because of the high health cost, they have been in the so-called wealthy groups of society. Although these calculations are in terms of per capital household expenditures, but because of the high proportion of treatment costs in the total expenditures, the percent of households have been in the high quintile [13]. Therefore, strategies that increase income among low-income households and narrow the income gap can be implemented, or efforts that improve the literacy should be made, further to reduce the effects of economic status or literacy status for CHE, respectively [46]. Another important finding was that presence of elder lies’ household increase the probability of household CHE. This is consisted with results reported by Yazdi- Feyzabadi et al. in Iran [32]. In this regard, it can be noted that a longer life span increases the probability of emerging new and costly non-communicable diseases (e.g. Musculoskeletal, neurological and dementia diseases) [47].
The risk of CHE increased when the members in household in both years went to hospital for outpatient services. These results matched of those of Anbari et al. [48] who found that hospitalization was one of the highest predictors of facing CHE, in Iran. It is realized that households with one or more inpatients or outpatients are at higher risks to encounter CHE because of the higher demands of health care. There are several possible explanations for these results. First, more severe illnesses require hospitalization and patients might require medication or formulation that are not covered by the insurance or that providers do not offer at the listed prices, requesting the difference from the patient. Moreover, hospitalization increases transport cost for the family members and thus direct non-medical spending. Third, the fee-for-service structure of the insurance may favor supplier induced demand that raises expenses including those not covered by the insurance [30]. Indeed, the relationship between care provider and patient is characterized by asymmetric information, the care provider may increase the demand for care and therefore the increase in the financial burden borne by the patient [30]. These results suggest a need for improvement of the HSEP’s implementation in terms of strengthening functions and the means of regulation and control. In addition, residents in developing regions who get access to outpatient service are at higher risk of experiencing CHE than those in developed regions, this is vice versa about inpatient services. For instance, in some developed provinces such as Tehran, Fars and Isfahan, the payments for inpatient care were by far more than those of undeveloped provinces. Policies for outpatients or inpatients should be adjusted according to the local conditions, for example, great efforts should be made to vigorously develop insurance for catastrophic illness in all provinces, and adjust reimbursement ratio for hospitalization [46- 49] in Iran, in order to reduce the rate of “poverty caused by diseases.”
By examining the incidence and intensity of FFC and CHE and by identifying the main factors associated with CHE, this study aimed to analyze the financial protection against the health payments’ risk of households affected by HSEP in Iran. The findings revealed that there were similar trends in the rates of CHE and FFC in urban areas. The rates of households experiencing CHE had decreased over the study period and it was higher in first and fifth quintiles and more developed regions. The rates of FFC across provinces and quintiles got also better over the HSEP. Economic status of households and households headed by an employed person (in 2012) and households with male householders (in 2015) are major protective factors for CHE; and number of members with illiterate householders and number of outpatients in household are the risk factors for CHE in both years. Besides, household with elderly members in 2012; and households with the number of members more than 5 in 2015 are more likely to experience the risk of CHE. It should be also noted that provinces had different CHE rates which might be affected by different features of the cultural and socio-economic factors. The Iranian government should pay more attention to the actual conditions in different provinces, further to make policy decisions according to the local knowledge.It is necessary to improve economic development, expand literacy and employment, and adjust policies to make greater efforts to protect outpatients, and inpatients, further to reduce the risk of CHE. In fact, the relationship between the health insurance, care providers and patients should be re-examined in order to reduce asymmetric information and provide better quality health care at a lower price (especially, for outpatient services) . However, the health sector evolution plan has just implemented in the early 2014, it affected some factors and indices significantly.
We conclude that a stepwise increase in progressive financing is a key factor both for equity of financing and sustainability of HSEP. Strict monitoring of the reform process, evaluating the results and transferring of findings to the stakeholders and general public are necessary. An accurate policy analysis for the continuation of the program components and new revisions/interventions can facilitate the process. All the requirements of the HSEP continuation should be considered properly in the sixth national development plan (2016- 2021) in line with the country general policies on health.
1The currency exchange rate of 1 $ in study years were as follows: 2012= 12260 Rial, 2015= 29582 Rial;
2PPP conversion factor, GDP (LCU per international $): purchasing power parity conversion factor is the number of units of a country’s currency required to buy the same amounts of goods and services in the domestic market as U.S. dollar would buy in the United States.
3The currency rate of 1 PPP $ were 5667.3 and 8161.5 in 2012 and 2015, respectively.
Citation: Ali Maher and Zahra Fazel. The Effects of Iran’s Health Sector Evolution Plan on Catastrophic Health Expenditures in 2012 and 2015(before and after the implementation of HSEP). Health Econ Outcome Res Open Access , 2021, 7(2): 168 (024-032).
Received: 01-Dec-2020 Published: 15-Feb-2021, DOI: 10.35248/2471-268X.21.7.168
Copyright: © 2021 Fazel Z, et al. This is an open-access article distributed under the terms of the Creative Commons Attribution License, which permits unrestricted use, distribution, and reproduction in any medium, provided the original author and source are credited.