Research Article - (2013) Volume 2, Issue 2
Objective: To evaluate the improvement in pain, function and quality of life of patients with knee osteoarthritis (OA) by means of an educational program.
Methods: Two hundred and five patients with knee OA were evenly allocated in four groups. Three groups had two days of lectures on Osteoarthritis (OA). All groups received printed material to read and a video with all the lectures. Groups 1, 2, and 3, had lectures one, two and three months apart respectively. Group 4 received the educational material only. Half of the patients (subgroups A) received a telephone call two months after the final lecture. At enrollment and four months after the final lecture or after receiving the educational material, patients were asked to answer LEQUESNE, WOMAC, VAS, and SF-36 questionnaires, both physical (PCS) and mental (MCS).
Results: Age wise all groups were similar. BMI was significantly higher in group 4. In general, all groups improved in pain, function and quality of life with no significant difference between groups for Lequesne, WOMAC, WOMAC pain, and SF36 PCS, or MCS. VAS showed significant difference favoring phone calls (p=0.021). Without telephone calls VAS scores trends (p=0.068) to be less in class attendants than in those that only retrieved the educational material.
Conclusions: The educational program improved pain, function and quality of life (both physical and mental). Telephone calls improved pain and classroom programs seem to be superior to educational material alone.
Keywords: Osteoarthritis, Knee, Education, Quality of life, Treatment outcome, Musculoskeletal pain
Osteoarthritis is the most frequent form of arthritis and the main cause of chronic disability [1]. The disease increases with longevity and obesity [2-4]. Gonarthritis is among the most prevalent and disabling types of OA [5]. The bilateral knee OA is more frequent than unilateral affecting 5% versus 2%, respectively of those between 45 and 74 years [6]. Of 63 patients followed for 11 years, 12 of each 13 developed knee OA counter lateral [7].
In Brazil, according to information from PNAD 2003 (National Survey of Households), 29.9% of the population reported to be suffering from at least one chronic disease (disease of spine or back, arthritis or rheumatism, cancer, diabetes or hyperglycemia, bronchitis or asthma, hypertension, heart disease, chronic kidney disease, depression, tuberculosis, tendinitis or tenosynovitis and cirrhosis), reaching 75.5% of the elderly. From PNAD 2008, the prevalence of arthritis or rheumatism corresponds to 5.7% of Brazil’s population [8].
OARSI guidelines exalts that an optimal management of OA requires a combination of pharmacological and non-pharmacological modalities, such as educational programs [9]. A meta-analysis with eleven studies and three other randomized controlled trials (not included in this meta-analysis) undertaken in Sweden, France and in the United Kingdom (UK), showed limited improvement in pain and function. The UK study showed no superiority of a self-management course when an educational booklet was given [10-13]. However, it is feasible in a primary care setting and it can improve self-perceived health as well as function and a structured consultation program for patients with knee OA resulted in short term improvement in weight loss and time spent on physical activity [11,12]. A telephonebased osteoarthritis self-management program produced moderate improvements in pain, particularly compared with a health education control group [14].
Longevity and Obesity are increasing in Brazil [15,16]. An educational program for patients is only necessary. With this in mind we created an educational program that could be reinforced by telephone calls from the physician team. This is a pilot study to evaluate the improvement in pain, function and quality of life of patients with knee osteoarthritis by means of an educational program and telephone calls.
Trial design
Randomized controlled trial.
Objectives
The primary objective is to evaluate if a classroom course is superior to educational material alone in respect to improvement in pain, function and quality of life of OA patients. Secondary objectives are to evaluate best interval between two days of classes and if telephone calls intervene in the final result.
Participants
Patients were followed form January and July, 2012. To meet the eligibility criteria, patients should have met the American College of Rheumatology criteria for knee OA [17]; no rheumatoid arthritis or any other rheumatologic disease other than OA; been receiving usual care for OA in the past six months; not having any neurological problems and been able to understand and agree with the informed consent, and the questionnaires. The exclusion criteria included undergoing surgery during the study, missing classes and missing reassessment.
At the time of the beginning of the study, there were 306 patients being treated for knee OA at the Osteometabolic Diseases Group- Department of Orthopedics and Traumatology-Hospital das Clinicas - University of São Paulo (Figure 1)-tertiary health care. All patients in our department received the same treatment protocol for more than six months prior to engaging in this study. Medications include: diacerhein for all patients, paracetamol and codein according to pain, vitamin D 1000 IU/day according to blood level and calcium supplements according to diet and age. All patients who had varus or valgus deformity were prescribed with lateral wedge insoles and those who needed support were prescribed with a Cain. Acupuncture was offered as well as orientation for physical activity. NSAIDs were exceptionally used. All patients were invited to participate in the program both by telephone calls and invitation during appointments. Two hundred and thirty patients were eligible and did accept to participate and were randomly divided in eight groups of 28 or 29 patients.
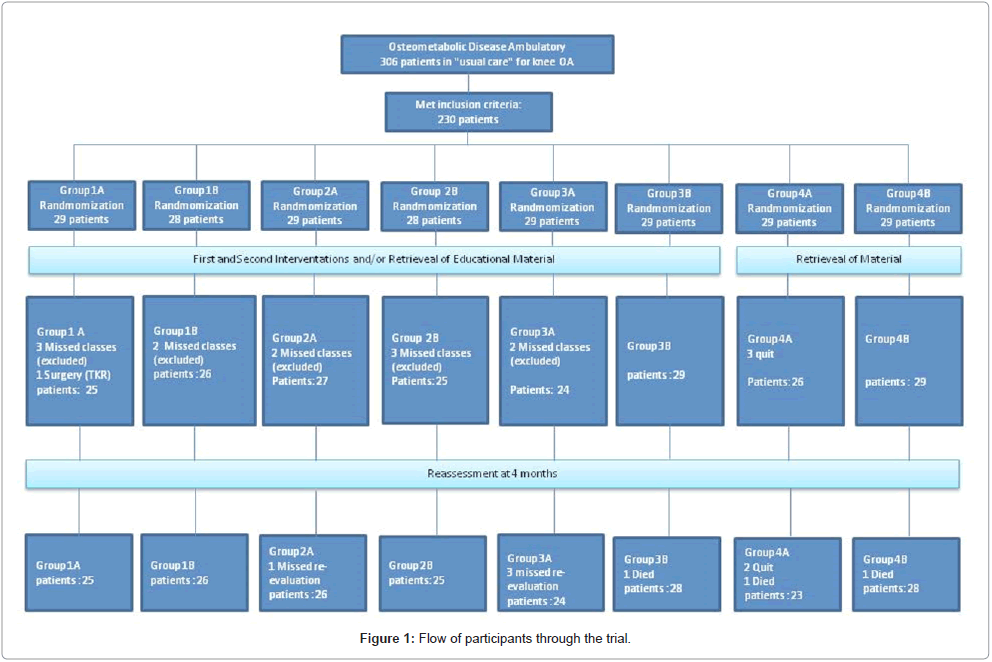
Figure 1: Flow of participants through the trial.
At enrollment patients were asked to respond to VAS (Visual Analogue Scale), WOMAC™, Lequesne, and SF-36 questionnaires [18-21]. Anthropometric data also were collected. All patients had plain radiograph of their knees including weigthbearing Anteriorposterior (AP), lateral and patellar axial views. Three orthopedic surgeons (MUR, AFP and TP) examined all radiographs to classify the severity of OA according to Kellgren and Lawrence [22]. In case of disagreement by two, the third was decisive.
Patients were divided in four groups. Group 1: two days of lectures one month apart; Group 2: two days of lectures two months apart; Group 3: two days of lectures three months apart. Group 4 had no classroom intervention. All groups received the educational handout and video of the lectures at study’s start. Each group was subdivided in A (received telephone calls bimonthly) and B (no telephone calls). Patients of each group were asked to come to the hospital in two specific Saturdays according to the intervals of each group.
Seven different professionals participated in the lectures: orthopedic surgeons, physical therapists, psychologists, nutrionist, physical educators, social workers and occupational therapists. The program of the first intervention day was explanatory by all professionals. The physicians explained the definition of a joint and of the disease, causes of OA, its irreversibility, and forms of treatment. The psychologist focused on motivation and coping skills. The physical therapist, as well as the physical educators showed the importance of exercises. The occupational therapist taught how to optimize the use of joints and to alternate different levels of energy expenditure (alternate low and high energy tasks during the day). The nutrionist explained the importance of small, frequent and low calorie but yet well balanced diet. Social workers highlighted the importance of leisure, social tasks and sports. Occupational therapy had a house exemplified with bedroom, bathroom, kitchen and living room to show how to protect joints in daily activities. Physical therapy showed patients a series of exercises to be done at least three times a week. The second intervention day (one, two or three months after the first intervention) was more interrogative by each team. It started with the social workers asking what activities suggested the patients had actually done or sought and the difficulties found in the procurement. Psychology made a group session where patients shared their experiences with the program. Physical therapy repeated the exercise program taught in the first day of class. Occupational therapy engaged in showing how to administer a week’s activity avoiding heavy work and alternating with less strenuous activities. The nutrionist reviewed the diet with the patients. The physical educators taught how to meditate, and the physicians finalized questioning the patients on OA: causes and treatment modalities, importance of exercise, leisure, changing habits and diet.
The booklets had a short introduction of the program as well as written and imaging information from all lectures given in the first classroom day with all the routine exercises offered both by physical therapy and physical educators, and practical orientations by occupational therapy in daily living. The DVD had a small introduction, seven theoretical lectures (Orthopedics, psychology, nutrition, physical therapy, occupational therapy, physical fitness, social work) and three practices (Physical therapy, physical fitness and occupational therapy). All according to what was taught in the first Saturday Classroom day. The DVD is 2 hours and 23 minutes long. Patients watched the DVD for the first time in the hospital. They were asked to read the text and/or watch the DVD at home at least three times later on.
Patients on subgroup A were called, by the physicians, two months after the lecture and asked about pain, medications, diet, occupational therapy orientations, if they were doing any social and/or physical activity and how many times a week. They were reinforced to read the booklet or watch the DVD as well as to exercise and correct dieting, social and occupational habits.
Four months after the final lecture or after receiving the educational material, patients returned for evaluation and were asked to answer LEQUESNE, WOMAC™, VAS, and SF-36 questionnaires. The evaluators were blinded to the allocation.
Randomization was performed by a computer generated program (available at http://www.randmization.com/). Patients were randomly allocated in one of the 4 groups (Figure 1). Patients that missed the reassessment were excluded from analysis. First the nominal characteristics were described according to groups with use of absolute and relative frequencies and verified the existence of association between groups and features with the use of chi-square test and the likelihood ratio for race. The degree of osteoarthritis was compared between groups using the Kruskal-Wallis test. Quantitative characteristics were described according to groups with use of summary measures (mean, standard deviation) and compared between groups using Analysis Of Variance (ANOVA) followed by Tukey’s multiple comparisons to compare groups two by two.
Score were described according to groups, presence of telephone call and moments of evaluation with use of summary measures (mean, standard deviation and interval at 95% confidence). Values were compared between groups, telephone call and moments (assessment) using analysis of variance with repeated measures with three factors, followed by Tukey’s multiple comparisons to compare groups, telephone call and moments when needed.
The tests were performed with a significance level of 5%. Processing was carried out by SPSS 17.
Three hundred and six patients were assessed for eligibility, the number of patients who met the inclusion criteria were 246, however, only 230 accepted to participate (Figure 1). Twenty-eight patients (each) were assigned to groups 1B and 2B; 29 patients were assigned for each of the remaining groups. Twenty-five patients were excluded from the study, of which 5 were from group 4. One participant died before the second intervention and two died before reassessment. One patient was submitted to total knee arthroplasty before reassessment and therefore also excluded. Twelve patients missed classes and were excluded. Four patients missed re-evaluation and five patients quit the program and were all from group 4 (Figure 1).
Table 1 shows that the characteristics assessed (gender, race, bilaterality) do not show statistically significant association with patient groups (p>0.05), ie, the groups are homogeneous for nominal characteristics evaluated. No statistically significant difference in the degree of osteoarthritis among groups (p=0.102 and p=0.413).
| Variables | Group | Mean | SD | CI (95%) | Number | p value | |
| Maximum | Minimum | ||||||
| Age (years) | 1A | 64.8 | 11.7 | 59.9 | 69.7 | 24 | 0.231 |
| 1B | 63.6 | 10.0 | 59.8 | 67.5 | 28 | ||
| 2A | 61.5 | 10.9 | 57.1 | 66.0 | 26 | ||
| 2B | 60.6 | 8.5 | 57.1 | 64.1 | 25 | ||
| 3A | 64.8 | 8.7 | 61.2 | 68.4 | 25 | ||
| 3B | 67.9 | 10.5 | 63.6 | 72.1 | 26 | ||
| 4A | 62.5 | 9.5 | 58.7 | 66.3 | 27 | ||
| 4B | 65.1 | 10.6 | 61.2 | 69.0 | 31 | ||
| BMI (kg/M2) | 1A | 29.8 | 4.2 | 28.0 | 31.6 | 24 | 0.000 |
| 1B | 37.4 | 4.4 | 35.7 | 39.1 | 28 | ||
| 2A | 33.3 | 6.3 | 30.8 | 35.8 | 26 | ||
| 2B | 32.3 | 5.7 | 30.0 | 34.7 | 25 | ||
| 3A | 30.4 | 5.3 | 28.2 | 32.5 | 25 | ||
| 3B | 29.8 | 4.9 | 27.8 | 31.7 | 26 | ||
| 4A | 35.9 | 6.6 | 33.3 | 38.5 | 27 | ||
| 4B | 37.1 | 5.1 | 35.2 | 38.9 | 31 | ||
Table 1: Description of personal and clinical characteristics of patients according to groups.
Table 2 shows that BMI was significantly different between groups (p<0.001). Group 4 (retrieved educational material only) was classified as obesity grade II whereas all other groups were obesity grade I (p<0.05). The results of WOMAC, WOMAC pain, Lequesne, VAS, SF36 (mental and physical) are shown in Tables 3 and 4. All groups improved from baseline to reassessment with no statistical difference between them. WOMAC, WOMAC pain and quality of life (both mental and physical) improved from baseline to reassessment 4 months after the intervention (p=0.003, p=0.018, p=0.009 and p=0.002 respectively). The WOMAC score declined 3.42 points, WOMAC pain eased 0.68 points and the mean score of psychological quality of life increased 1.79 points regardless of group or telephone call. The telephone call improved pain (visual analogue scale) (p=0.021) in comparison to those who did not receive a telephone call. When analyzing only the subgroups that did not receive telephone calls, those who did not attend classes presented more pain than those that had classes with one month interval (p=0.068). There were no adverse events. Patients did not perform exercises if they did not feel capable of performing. No patient complaint of injury because of exercising, or of following recommendations from the booklet, DVD or classroom lectures.
| Variables | Group | Mean | SD | 95% CI | N | p | |
| Lower | Upper | ||||||
| Age (years) | 1 | 65.2 | 10.8 | 62.3 | 68.2 | 52 | 0.06 |
| 2 | 62.0 | 9.7 | 59.4 | 64.7 | 51 | ||
| 3 | 67.4 | 9.7 | 64.7 | 70.0 | 51 | ||
| 4 | 65.1 | 9.2 | 62.6 | 67.7 | 51 | ||
| Years of education (schooling) | 1 | 7.4 | 2.8 | 6.6 | 8.2 | 52 | 0.514 |
| 2 | 7.8 | 3.3 | 6.9 | 8.7 | 50 | ||
| 3 | 7.8 | 3.6 | 6.8 | 8.7 | 51 | ||
| 4 | 8.3 | 2.2 | 7.7 | 8.9 | 51 | ||
| BMI (kg/m2) | 1 | 33.9 | 5.7 | 32.4 | 35.5 | 52 | <0.001 |
| 2 | 32.8 | 5.9 | 31.2 | 34.4 | 51 | ||
| 3 | 30.1 | 5.0 | 28.7 | 31.4 | 51 | ||
| 4 | 36.6 | 5.7 | 35.0 | 38.1 | 51 | ||
| ANOVA | |||||||
Table 2: Description of quantitative characteristics according to groups.
| Group | WOMAC | WOMAC Pain | Lequesne | ||||
| Baseline | Reassessment | Baseline | Reassessment | Baseline | Reassessment | ||
| 1A | Mean | 44.7 | 37 | 8.8 | 7.5 | 11.6 | 10.5 |
| CI (95%) | 36.6-52.9 | 30-44 | 7-10.5 | 6.1-9.9 | 9.8-13.3 | 9-11.9 | |
| 1B | Mean | 48.8 | 44.6 | 9.1 | 8 | 12.2 | 12.1 |
| CI (95%) | 42.7-54.9 | 39.3-49.8 | 7.5-10.8 | 6.5-9.5 | 10.7-13.8 | 10.8-13.5 | |
| 2A | Mean | 48.4 | 43.1 | 9.6 | 8.9 | 11.9 | 12.4 |
| CI (95%) | 41.5-55.3 | 34.7-51.4 | 8.4-10.9 | 7.1-10.6 | 10.3-13.5 | 10.6-14.1 | |
| 2B | Mean | 47.2 | 41.3 | 9.9 | 8.6 | 12.5 | 11.8 |
| CI (95%) | 39.2-55.2 | 33.6-48.9 | 8.1-11.7 | 6.9-10.4 | 10.7-14.3 | 10.2-13.3 | |
| 3A | Mean | 44.2 | 38.2 | 8.5 | 7.9 | 11.3 | 10.6 |
| CI (95%) | 36.7-51.7 | 32.9-43.5 | 6.8-10.2 | 6.6-9.2 | 9.8-12.9 | 9.0-12.2 | |
| 3B | Mean | 43 | 45 | 9 | 8.7 | 11.8 | 12.2 |
| CI (95%) | 35.1-50.9 | 36.9-53.0 | 7.4-10.6 | 7.2-10.3 | 9.9-13.7 | 10.5-13.8 | |
| 4A | Mean | 44.3 | 43.7 | 9.4 | 8.9 | 11.6 | 12.4 |
| CI (95%) | 39.2-49.5 | 37.3-50.2 | 7.9-10.9 | 7.6-10.2 | 9.7-13.4 | 10.5-14.2 | |
| 4B | Mean | 42.7 | 41.5 | 8 | 8.3 | 12.4 | 11.5 |
| CI (95%) | 35.5-50.0 | 34.8-48.2 | 6.6-9.5 | 7-9.6 | 10.8-13.9 | 10.0-13 | |
| p=0.365 | p=0.838 | p=0.0413 | |||||
Table 3: Womac, Womac pain and Lequesne scores results by groups and moments and telephone calls.
| Group | WOMAC | WOMAC Pain | Lequesne | ||||
| Baseline | Reassessment | Baseline | Reassessment | Baseline | Reassessment | ||
| 1A | Mean | 56 | 46.7 | 44.2 | 47.6 | 33.1 | 36.7 |
| CI (95%) | 45.1-66.8 | 37.1-56.2 | 39.1-49.2 | 42.5-52.6 | 29.7-36.5 | 33.5-39.8 | |
| 1B | Mean | 60.6 | 58.5 | 46.6 | 46.9 | 36.6 | 33.9 |
| CI (95%) | 51-70.3 | 50.9-66.1 | 41.2-52.1 | 42.3-51.5 | 29.4-35.8 | 31-36.8 | |
| 2A | Mean | 67.8 | 47.8 | 44.8 | 46.2 | 30.1 | 33.6 |
| CI (95%) | 58.3-77.4 | 37.0-58.7 | 39.6-50.1 | 41.3-51.2 | 27.5-32.7 | 29.8-37.5 | |
| 2B | Mean | 60.8 | 59.2 | 43.6 | 47.3 | 33 | 34.6 |
| CI (95%) | 49.0-72.7 | 48.8-69.6 | 38.2-49.0 | 43-51.6 | 29.2-36.7 | 31.1-38.0 | |
| 3A | Mean | 61.6 | 61.1 | 48.3 | 50.4 | 31.6 | 33.5 |
| CI (95%) | 51.4-71.8 | 51.0-71.2 | 43.6-53.0 | 45.6-55.3 | 28-35.3 | 29.8-37.3 | |
| 3B | Mean | 47 | 46.9 | 46.5 | 47 | 34.4 | 37.9 |
| CI (95%) | 35.8-58.2 | 38.6-55.2 | 42.5-50.4 | 43.6-50.4 | 31.4-37.5 | 34.4-41.4 | |
| 4A | Mean | 51.5 | 59.1 | 45.8 | 47.8 | 33.9 | 33.7 |
| CI (95%) | 41.1-61.9 | 50.7-67.5 | 41-50.5 | 43.8-51.7 | 30.7-37 | 30-37.3 | |
| 4B | Mean | 61.5 | 60.3 | 45.1 | 45.5 | 32.5 | 32.4 |
| CI (95%) | 51.2-71.8 | 52-68.5 | 39.8-50.4 | 41.2-50 | 29.6-35.3 | 29.1-35.8 | |
| p=0.026 | p=0.910 | p=0.475 | |||||
Table 4: VAS, SF36 MCS and SF36 PSC scores results by groups and moments and telephone call (control calling).
OA is a leading cause of chronic disability [1]. It increases with age and obesity [2-4]. Obesity and age are increasing in Brazil, therefore so is the number of OA patients [8,15]. Thus, an educational program aiming to change the OA patient’s fate by decreasing BMI, increasing physical activity and giving tools to enhance their quality of life is primordial to ease such a burden to the society. To the best of our knowledge, this is the first study, in Brazil, to evaluate the impact of an educational program intervention in OA patients.
Our study has some limitations. First, we did not limit the use of analgesics or any other non-pharmacological treatment. We believe that an educational program should not exclude any other type of OA treatment; therefore, patients received usual care but were asked to keep track of the use of analgesics, with no specific analysis between groups in this study. Non-steroidal anti-inflammatory drugs were not prescribed. Patients were already receiving medications prior to enrollment. Medications were not increased between enrollment and reassessment. Second, no objective method was performed to evaluate disease progression, such as joint space width [23] or MRI [24]. It’s a pilot study to evaluate the best form of educational program for OA patients. Our emphasis was in patient’s symptoms and quality of life. A longer follow-up, larger sample and avoidance of K&L grade IV would have to be included in this design to evaluate the effects of education on disease progression. Third, the group scheduled to receive the educational material without classes had a significant higher BMI. That could be a potential bias. All groups showed some improvement (Tables 3 and 4) however different they were in BMI, so at this point the difference of BMI did not intervene in the results. Fourth, no analysis was done about the comprehension of the classes and of the educational material given or with satisfaction with the program. We believe it to be a next step when we are able to identify compliers with non-compliers.
This was a pilot study to identify the best approach to improve pain, function and quality of life of OA patients. All groups showed some small improvement (pain and/or function and/or quality of life) irrespective of classes or telephone calls (Tables 3 and 4). There are some observations from this: First, repeating the program at one, two or three months showed no significant difference. Second, one telephone call between education and reassessment did change pain results. It must be observed at one year if more frequent telephone calls are needed [14]. Telephone calls have been used to improve results in the treatment of knee and hip OA [9,14]. A suggestive difference between classroom groups and educational material only groups was observed in VAS scoring. Subgroup that did not receive telephone calls and did not attend classes (4B) presented more pain than those that had classes with one month interval (1B) (p=0.068).
Actually, there are subtle differences not addressed at this point of the study, such as adhesion to physical activity and diet that we would like to explore at longer follow-up. There are noticeable copping differences among the participants. Several participants assumed an active role in changing diet and exercising, others only changed habits after observing the improvement of co-participants in the second intervention. In the same rationale, some participants from group 4 studied the material and changed their habits. Many others, from group 4, either abandoned the program or continued but did not read the material at all. We believe that the attention given by the multi-professional team, the interaction between participants in the workshops and during meals and the repetition of information are all factors that influence behavior change.
We conclude that an education program for OA patients diminished pain and improved function and quality of life. It is feasible in primary care and should consist of classroom lectures and handout/audiovisual information.
Marcia Uchoa de Rezende, Gustavo Constantino de Campos, Alexandre Felicio Pailo, Renato Frucchi and Thiago Pasqualin participated in the study design, data collection, interpretation, writing of the manuscript draft and revised the final version. Olavo Pires de Camargo participated in the study design and revised the final version.
This study was developed in Faculdade de Medicina-Universidade de São Paulo (FMUSP).
This prospective randomized controlled trial was conducted under the principles of the Helsinki Declaration and approved by the Ethics Committee for the Analysis of Research Projects (CAPPesq) under the protocol number 0622/11. Clinical Trials registration number: NCT01572051.
This Study was funded both by TRB Pharma™-Brazil and Department of Orthopedics and Traumatology-Hospital das Clínicas- University of São Paulo, which had no role in project implementation, analysis, interpretation, or manuscript writing.
This study was approved by the Ethics Committee of Hospital das Clínicas, Faculdade de Medicina da Universidade de São Paulo, number CAPPesq 0622/11. Clinical Trials registration number: NCT01572051.
TRIAL REGISTRATION: Clinical Trials NCT01572051.
This Study was funded both by TRB Pharma™-Brazil and Department of Orthopedics and Traumatology-Hospital das Clínicas- University of São Paulo, which had no role in project implementation, analysis, interpretation, or manuscript writing.
This study could not been performed without the voluntary help of Heloísa Ungaro, Paulo Dallari, Miriam Damaris Di Maio, Alípio Jose Gusmão dos Santos, Pérola Grinberg Plapler and secretaries, occupational therapists, social workers, physical therapists, psychologists, nutrionist, physical educators, security staff of Hospital das Clínicas-Department of Orthopedics-FMUSP.