Research Article - (2017) Volume 0, Issue 0
Favorable economic conditions are typically correlated with good health outcomes. However, Mexican immigrants in the U.S., although economically disadvantaged, tend to present better health outcomes than non-Hispanic Whites. This phenomenon is known as the Mexican-American Health Paradox. Using a variant of the Blinder-Oaxaca decomposition methodology proposed by Martinez et al., and combining health data from Mexico and the U.S., this paper seeks to explain the Mexican-American Health Paradox for two different age cohorts. Our findings suggest that, if Mexican migrants had on average the same unobserved characteristics as non-migrants in Mexico their relative health status in the US would be even better. Our results highlight the importance of taking into account age differences of migrants and show that selectivity is a complex process that does not work in the same way for different age cohorts.
Keywords: Health; Paradox; Mexico; Migration; Selectivity
Accounting for almost 3% of the total population, Mexican-born immigrants represent the largest and fastest growing population group in the U.S. [1,2]. However, this population group tends to be economically disadvantaged with respect to natives and other population groups [3,4]. The health literature tends to find that economically disadvantaged population groups present poor health conditions [5]. However, empirical studies like Arias [6] reported that Hispanics had a life expectancy of 80.6 years in 2006, longer than any other ethnic (or racial) group in the U.S The (2010 life expectancy at birth in the U.S. was 78.3 according to the Pan American Health Organization (2012)). These characteristics give rise to the phenomenon known as the Hispanic Health Paradox (HHP), and there are several health measures used in the literature that can be employed to analyze it: mortality rates, morbidity rates, or other indicators such as the Mental Component Summary (MCS) or the Physical Component Summary (PCS) [For a definition of MCS and PCS see Rangel-Gonzalez (2005)].
Using a variant of the Blinder-Oaxaca decomposition methodology proposed by Martinez et al. [1], focusing on the Mexican-born immigrant population and combining health data from Mexico and the U.S., this paper seeks to explain the HHP for two different age cohorts and four important degenerative chronic diseases (cancer, heart conditions, diabetes, and hypertension). As Martinez et al. [1] asserts, the use of the Blinder-Oaxaca methodology allow us to identify how much of the HHP can be explained by migrants’ self-selection in terms of observable vs. unobservable characteristics of migrants. Self-selection implies that Mexican immigrants in the U.S. have characteristics that make them less likely to have the disease than nonmigrants in Mexico, and those characteristics can be observed, like age and gender, or unobserved, like genetics or the amount and quality of food intakes. Some characteristics might be unobserved due to simple data omissions or complete unavailability but might still affect the prevalence of disease.
This paper analyses degenerative chronic diseases such as cancer, heart conditions, diabetes and hypertension because this kind of diseases affect the long-run quality of life of individuals and might also affect their decisions to migrate. Following the work of Sjaastad and Todaro, individuals decide to migrate based on a utility maximization process in which the migrant takes into account the costs and benefits of moving. This implies that better health condition for life (and a longer life expectancy) is expected to increase the benefits and lower the costs of migration.
In addition, these four diseases represent an estimate of 75% of all health care expenditures in the U.S. (National Center for Chronic Disease Prevention and Health Promotion 2009), representing 16.2% of the U.S. GDP. Furthermore, heart conditions, cancer, and diabetes are among the 10 leading causes of death in the U.S. [7], and even though hypertension is not one of the leading causes of death in the U.S., it affects one third of all adults age 18 and older. Correspondingly, in Mexico these four diseases are among the 10 leading causes of death [7], and diabetes had been identified as the main cause of death in Mexico since 1990. [It should be noted that relying on these diseases as health indicators might be problematic due to the dependence on detection. This issue is particularly important when comparing health outcomes for groups with significant differences in access and use of health care, as the difference between the non-Hispanic White and the Hispanic populations in the U.S. This issue might be partly offset by controlling for access to health insurance, but there might still be a bias in favor of finding lower disease incidence among the Hispanic population in the U.S].
The analysis presented in this paper considers separately two age cohorts in order to better observe the effects of these life-time diseases on the individuals decision to migrate. It has been widely documented by physicians that these conditions tend to deteriorate with age (for that reason many measures of health such as mortality rates are usually reported as age-adjusted), so the disease prevalence varies significantly across age cohorts [8,9].
In addition, it is important to separate the population in these two age groups since the selectivity effects might vary across age. For instance, analyzing separately the younger cohort, could provide us a cleaner identification of the migrant selectivity problem since this group is less likely to suffer from some data biases mentioned in the literature such as the salmon bias.
Using migrant’s data from the country of origin and destination allow us to assess the effects of health selectivity of Mexican immigrants by explicitly considering the population where they are drawn from, the non-migrant population in Mexico [10] support this claiming stating that the analysis of potential health selectivity of migrants requires a comparison between migrants and non-migrants in the sending countries at time of migration. Using data from the county of origin, Rubalcava et al. [11] find weak evidence of positive selection of Mexican migrants in terms of overall health. Using data from both countries of origin and destination Riosema et al. [12] and Bostean et al. [13] find evidence of positive selection of Mexican migrants in terms of self-rated health, while Martinez et al. [1] find evidence that health selectivity do not work the same way for different health conditions and across genders. However, Hummer et al. [14-17] uses data on very recent mothers of Mexican-origin, with very low probability of return migration, to show that infant mortality rates are significantly lower for children from Mexican-origin mothers as compared to children from non-Hispanic White mothers. We found that selectivity in terms of observed and unobserved characteristics is playing a significant role in the relatively good health performance of Mexican migrants in the U.S. For the most part, there is evidence of positive selection in terms of observed characteristics and negative selection in terms of unobserved characteristics. The findings suggest that if Mexican migrants in the U.S. had similar unobserved characteristics as non-migrants in Mexico their relatively good health performance in the U.S. would be even better.
The rest of the paper is organized as follows. The next section contains a brief literature review. A description of the two data sources is presented in the third section. The econometric methodology and the results are presented in section four and five, respectively. The last section presents the conclusions.
For the most part, the economic literature attempts to explain the Mexican-American Health Paradox or Hispanic Health Paradox (HHP) using three “standard” theories: data artifacts, migration effects, and cultural effects [12]. The data artifacts theory suggests that the HHP can be explained by the misreporting of data by minority groups. The migration effects theory suggests that the HHP can be explained by the return of migrants to their countries of origin when they get ill or have poor health conditions (the salmon effect). [However, Abraido- Lanza et al. [17] found that the HHP still applies to Cubans who usually do not return to Cuba and to Puerto Ricans, who can be followed once in Puerto Rico] and the self-selection of healthy migrants (the healthy migrant effect). The healthy migrant effects suggest that migrants’ relatively good health performance in the U.S. is because they tend to be positively self-selected and therefore healthier than the average individual in their host country. Finally, the cultural effects theory argues that health is a reflection of cultural conditions such as family structure, social networks, and specific behaviors. In this context, Mexican-born immigrants benefit from belonging to a culture with a closer relationship with their kind.
An alternative explanation for the HHP is presented by The National Alliance for Hispanic Health (2001) that suggests that differences in nutrition or food intakes between the two groups might help to explain the paradox [According to this theory, Mexican-Americans must have healthier diets than non-Hispanic Whites and therefore a better diet is reflected in better health. Some of the literature refers to these differences in food intakes as differences in epidemiological regimes, or a protection effect generated in the sending nation]. Finally, Rangel-González [18] suggests that relative deprivation (a concept formalized by Yitzhaki [19] and used by Deaton [20] to explain health) explains part of the Mexican-American Health Paradox, mainly because Mexican- Americans use the population living in Mexico as a reference group instead of the native population living in the U.S. The idea is that migrants who feel economically disadvantaged compared to natives in the host country may feel depressed, frustrated and/or irritated, conditions that affect health conditions. Rangel-Gonzalez [18] claims that Mexican-Americans might use de the population living in Mexico instead of the population living in the US as a reference group [The index of relative deprivation is lower for Mexican-Americans when using the population living in Mexico as a reference group].
The HHP has been studied in the literature using mortality rates, morbidity rates, and other health indicators. Using mortality rates, Sorlie et al. [21] Hummer et al. [15,16], Singh and Siahpush [22,23], Abraido-Lanza [17] and Palloni and Arias [12] report that Hispanics in general and Mexican-born immigrants in particular present better health outcomes than non-Hispanic Whites and other population groups. In addition, Hummer et al. [16] show that the health advantage of Mexican-Americans over non-Hispanic Whites varies by age cohort. After controlling for socioeconomic factors, the authors find that mortality outcomes for Mexican-Americans and other Hispanic young adults (18 to 44 year olds) do not differ significantly from mortality outcomes for non-Hispanic Whites, while Mexican-Americans and other Hispanics age 45 and older present significantly lower mortality rates than non-Hispanic Whites.
Using morbidity outcomes such as cancer, hypertension, heart diseases, and respiratory diseases, the National Alliance for Hispanic Health, Glanz et al. [24], the National Center for Health Statistics [25], Bell et al. [26], Ostir et al. [27], Grant et al. [28], Collins et al. [29], Pear et al. [30], Alegria et al. [31], and Martinez et al. [1] have also found health advantages for Mexican-born immigrants compared to non- Hispanic Whites and other population groups.
Given data restrictions, the majority of studies try to analyze the HHP by comparing the health outcomes of non-Hispanic Whites in the U.S. and Mexican-born migrants, or other Hispanic groups also in the U.S. However, this method may generate misleading conclusions because migrants might not be randomly drawn from their countries of origin. Evaluating the health selectivity of migrants requires a comparison between migrants and non-migrants in the sending countries at time of migration [10]. Martinez et al. [1] showed that selectivity might play an important role in explaining such differences between these two groups. This paper uses Martinez et al. [1] methodology to try to explain the HPP for two different age cohorts and four important degenerative diseases. Unlike Martinez et al. [1] who study the HPP across genders, this paper utilizes more recent data from the country-of-origin (Mexico) and from the U.S. to consider the potential for health selectivity of Mexican migrants in the U.S. for different age cohorts, which allow us to find more accurate results for younger and older populations.
Data
This study utilizes data from the U.S. National Health Interview Survey (NHIS) for 2012, conducted by the National Center for Health Statistics, and data from the 2012 Mexican Survey of Health and Nutrition (ENSANUT), conducted in Mexico by the National Institute of Public Health and the Mexican Ministry of Health. The 2012 NHIS and 2012 ENSANUT dataset contain information on a variety of health measures and socioeconomic characteristics. The 2012 NHIS dataset contains information on around 27,000 individuals and it is representative at the national level [Although the NHIS is representative at the national level, it is not necessarily representative of the different race and ethnic groups considered independently in this study. More specifically, the NHIS is subject to under coverage and under response bias for the Hispanic population when compared to the non-Hispanic White population [9,32]. Consequently, comparison of these groups might be problematic. Another problem to consider in the NHIS is the possible under coverage of the young, undocumented, and least-skilled migrants, as Ibarraran and Lubotsky [33] discuss for the U.S. Census. Results should be taken with caution]. The 2012 ENSANUT dataset contains information on about 110,000 individuals and is also representative at the national level. Both health surveys are very similar in objectives, scope, schemes and methodologies and in both surveys health conditions are referred to diagnosed conditions [With respect to the questions to inquire into the individuals´ health condition, both databases (ENSANUT and NHIS) ask: “Have you ever been told by a doctor or health professional that you have …”. As commented in the introduction, it is possible that individuals from some population groups may have lower access to health services and hence lower chances to be diagnosed with a specific disease than other population groups, resulting in a bias favoring economically disadvantaged groups. It is also possible that individuals may lie with respect to their health conditions, however, no evidence have been found to believe that some groups have reasons to lie in a different way than others. Furthermore, there are no reasons (or prior evidence) to believe that the bias generated by self-reported conditions varies across Mexicans, Mexican migrants, and non-Hispanic Whites]. Based on age and race/ethnicity restrictions and list-wise deletion for both datasets, the analytical sample sizes for the NHIS and the ENSANUT are 13,857 and 25,641 observations respectively.
Summary statistics for the 2012 NHIS and ENSANUT datasets are presented in Table 1. The table presents means of all variables used in the study, divided by age cohort: adults (25 to 44 year olds) and older adults (45 to 64 year olds). Mean differences tests (Wald tests) (not reported in Table 1) were conducted between the three population groups considered: non-Hispanic Whites (from the NHIS), Mexican immigrants in the U.S. (from the NHIS), and non-migrant Mexicans in Mexico (from the ENSANUT); and between age cohorts: adults and older adults. For the most part, characteristics and health conditions are statistically different across population and age groups.
| Adults (25 to 44 year olds) | Older Adults (45 to 64 year olds) | |||||
|---|---|---|---|---|---|---|
| NH Whites (A) | NHIS Mexicans (B) | ENSANUT (C) | NH Whites (A) | NHIS Mexicans (B) | ENSANUT (C) | |
| Mean | Mean | Mean | Mean | Mean | Mean | |
| Cancer | 0.035 | 0.003 | 0.012 | 0.115 | 0.045 | 0.025 |
| Heart Condition | 0.042 | 0.018 | 0.035 | 0.079 | 0.016 | 0.058 |
| Hypertension | 0.131 | 0.101 | 0.081 | 0.370 | 0.314 | 0.251 |
| Diabetes | 0.027 | 0.035 | 0.037 | 0.118 | 0.169 | 0.171 |
| Age | 34.42 | 34.79 | 34.79 | 54.88 | 52.66 | 53.34 |
| Male | 0.472 | 0.484 | 0.363 | 0.481 | 0.492 | 0.407 |
| Married | 0.605 | 0.714 | 0.779 | 0.593 | 0.661 | 0.734 |
| Health Coverage | 0.814 | 0.431 | 0.807 | 0.863 | 0.575 | 0.829 |
| Years of Education | 14.24 | 10.38 | 8.33 | 13.96 | 9.19 | 6.16 |
| Family Kids (number) | 1.072 | 1.898 | 2.088 | 0.278 | 0.735 | 0.974 |
| Family Elders | 0.022 | 0.015 | 0.080 | 0.080 | 0.053 | 0.132 |
| Family Edu (category) | 4.434 | 2.908 | 2.896 | 4.300 | 2.853 | 2.706 |
| Family Income (decile) | 6.768 | 5.488 | 5.236 | 5.883 | 5.384 | 4.703 |
| Own House | 0.575 | 0.346 | 0.669 | 0.777 | 0.545 | 0.825 |
| Household Head | 0.903 | 0.887 | 0.851 | 0.956 | 0.902 | 0.937 |
| Smoker | 0.447 | 0.229 | 0.269 | 0.502 | 0.320 | 0.329 |
| English | 0.997 | 0.428 | 0.000 | 0.997 | 0.410 | 0.000 |
| Weight (lbs.) | 177.0 | 169.6 | 158.4 | 181.6 | 174.3 | 159.4 |
| Height (inches) | 67.61 | 65.18 | 62.24 | 67.22 | 65.11 | 61.62 |
| Observations | 5637 | 1004 | 15400 | 6706 | 510 | 10241 |
Table 1: Summary Statistics by Age Group for the 2012 NHIS and ENSANUT Samples.
On average, all four disease prevalence is considerably larger among older adults (45 to 64 year olds) compared to adults (25 to 44 year olds). Non-Hispanic Whites are statistically more likely to have cancer than Mexican immigrants in the U.S. and Mexicans in Mexico. In terms of heart conditions, prevalence is statistically larger for non- Hispanic Whites compared to Mexican migrants and non-migrant Mexicans in Mexico, while Mexican immigrants are considerably less likely to have a heart condition than non-migrants in Mexico.
Source: Own estimations with data from NHIS 2012 and ENSANUT 2012. Family Edu measures the highest educational attainment in the family in groups: 1:0-8 years, 2:9-11 years, 3:12 years, 4:13-14 years, 5:15-16 years, and 6:17 years and more.
Non-Hispanic Whites present higher rates of hypertension than Mexican migrants, and in turn Mexican immigrants present higher rates than non-migrants in Mexico. On the other hand, Mexicans, both in Mexico and in the U.S., present higher rates of diabetes than non-Hispanic Whites. There is no statistically significant difference in diabetes prevalence between Mexicans in Mexico and in the U.S [In terms of observed characteristics, non-migrants in Mexico are more likely to be married and have kids at home than Mexican immigrants in the U.S., and in turn Mexican immigrants in the U.S. are more likely to be married and have kids at home than non-Hispanic Whites. On the other hand, non-Hispanic Whites have higher educational attainment and family income, and tend to be heavier and taller than Mexican migrants, while Mexican immigrants have higher educational attainment and family income, and tend to be heavier and taller than non-migrants in Mexico].
As mentioned in the literature, the HHP could be explained in part by the effects of acculturation on observed characteristics and health outcomes. Acculturation has the potential to affect migrants’ health outcomes, and it makes it difficult to know whether or not their unobserved characteristics have been affected during the acculturation process. As an attempt to control for the effects of acculturation of migrants in the U.S. we exclude from our sample all migrants with 15 or more years in the U.S. Another proxy commonly used in the literature to control for the process of acculturation is to consider whether or not the migrant speaks English at home or the level of fluency [34,35]. Unfortunately, the NHIS does not provide this information explicitly. However, it reports the language used during the interview. Not surprisingly, the vast majority of non-Hispanic Whites responded to the survey in English, but only around 40% of all Mexican migrants surveyed were interviewed in English. While not a perfect measure of acculturation, we assume here that the more “acculturated” migrants were more likely to respond to the interview in English.
Methodology
Although disadvantaged in terms of observed characteristics, Mexican migrants tend to be healthier than non-Hispanic Whites in terms of cancer, heart condition, and hypertension, but not in terms of diabetes. Are Mexicans in the U.S. self-selected in terms of their health conditions? Or is their relatively good health performance a result of general conditions prevalent for all Mexicans? This study employs a variant of the Blinder [36]-Oaxaca [37] decomposition methodology proposed by Martinez et al. [1] to help explain health outcome differences between non-Hispanic Whites and Mexican immigrants in the U.S. This methodology facilitates the identification of the source and type of the health selectivity among Mexican immigrants in the U.S.
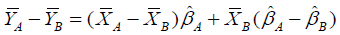
The Blinder-Oaxaca methodology is typically applied to analyze mean earnings differentials between two population groups. It starts by defining Yig as the earnings of individual i belonging to group g and Xig as a vector of observed individual characteristics, typically related to skills (education, experience, etc.). Based on a linear model and its classical assumptions, Ordinary Least Squares (OLS) can provide suitable coefficient estimates for each group. Following Oaxaca [37], the decomposition between population groups A and B can be specified as follows:
 (1)
(1)
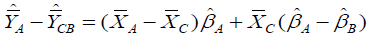
Where the bars above variables represent mean values and the hats indicate OLS coefficient estimates. Having the X’s as skills, the beta OLS estimates represent the compensation or return that workers receive for a particular level of skills. Equation (1) decomposes the mean earnings differential into two components: the explained portion, which captures the contribution to the wage differential due to differences in skills between groups  , and the unexplained portion, which captures the contribution due to differences in returns to skills between groups
  . As it is typically discussed in the literature, differences in the compensation or returns to skills between population groups is associated with assertions of discrimination.
Applying this methodology to the analysis of health would allow us to obtain estimates for the contribution of observed characteristics (age, gender, education, health coverage, etc.) and the contribution of the returns to those characteristics to the health outcome differences between two population groups (A and B). The typical Blinder-Oaxaca decomposition methodology is commonly applied to linear models with a continuous dependent variable like earnings, however, the analysis of dichotomous indicators, like having or not a disease, requires the use of a non-linear extension of the decomposition methodology [38,39].
However, in order to facilitate the identification of the source and type of the health selectivity we follow Martinez et al. [1] methodology and use a modified linear version. To do this, each dichotomous health indicator must be replaced by a corresponding continuous variable: the estimated probability of having a disease. To compute such predicted health outcomes, Probit regressions are run separately for each health indicator and for each group of age using as independent variables: age, gender, marital status, health coverage, years of education, family kids (number), family elders, family edu (category), family income (decile), own house, household head, smoker, English, weight (lbs.), and height (inches) [Probit regressions results can be provided by the authors upon request.] [40-42].
Once the predicted health outcomes are obtained, equation (1) is used to compare predicted health outcomes between non-Hispanic Whites (A) and Mexican immigrants in the U.S. (B). The decomposition results can be interpreted as follows: The first component represents the portion of disease rate differences that can be attributed to differences in observed characteristics, and the second component the portion that cannot be explained by differences in observed characteristics and it is due to differences in returns to those characteristics. The second component might be driven by differences in unobserved characteristics, like genetic endowments, cultural effects, environmental conditions, or other characteristics not observed by the statistician like quality of food intakes, exercise, and sleeping. As mentioned before, these characteristics might be unobserved due to simple data omissions or complete unavailability, but they might affect the prevalence of disease [It is important to note that some unobserved characteristics may be correlated with the observed ones, causing a possible bias in the Probit estimators. The size and sign of the bias is difficult to identify, but the use of the largest possible number of observed characteristics helps us to reduce this bias as much as possible].
However, the decomposition results comparing health outcomes between Mexican immigrants and non-Hispanic Whites do not represent in any way evidence of the health selectivity of Mexican migrants in the U.S. That can only be achieved by comparing the Mexican migrants to the population they were drawn from, the nonmigrant population in Mexico. To do so, we use information from Mexicans residing in Mexico (C), (which by nature might be less subjected to selection [According to Mincer, the decision to migrate takes place at the family level. The family’s efficient migration decision maximizes the total net benefits to all family members, including all costs. This implies that the family would choose to send the migrant that represents the greatest benefits to the family. According to the healthy migrant hypothesis, the healthiest member might also represent the greatest benefits from migration [43-46]. Therefore, family members that do not migrate are not as selected as the ones that migrate]) to complement information for Mexicans living in the U.S. (which might be selected).
Following Martinez et al. [1], we construct two artificial groups of individuals: Group (BC) having the observed characteristics of Mexican immigrants in the U.S.  , but the returns to characteristics of Mexicans living in Mexico
  . The other constructed group (CB) has the observed characteristics of non-migrants in Mexico
  , but the returns to characteristics of Mexican migrants in the U.S.
  . The predicted health outcomes for constructed group (BC) are:
 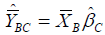 and the predicted health outcomes for constructed group (CB) are:
 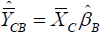 [For more information on how these two artificial groups are constructed [1].
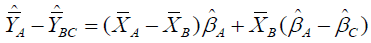
The next step is to obtain Blinder-Oaxaca decomposition estimates that compare non-Hispanic Whites (A) and each of the constructed groups (BC) and (CB), separately.
 (2)
(2)
 (3)
(3)
Equation (2) decomposes predicted health outcomes comparing non-Hispanic Whites (A) and the constructed group with the observed characteristics of Mexican immigrants but the unobserved characteristics of non-migrants in Mexico (BC), and equation (3) decomposes predicted health outcomes compering non-Hispanic Whites (A) and the constructed group with the observed characteristics of non-migrants in Mexico but the unobserved characteristics of Mexican immigrants in the US (CB).
Results from equations (1) and (2) are compared to obtain evidence of self-selection in terms of unobserved characteristics. If Mexican immigrants in the U.S. were randomly drawn from the Mexican population in terms of unobserved characteristics the second component of equations (1) and (2),  and
and  respectively, would be statistically identical. That is, any significant difference between these two components is interpreted as evidence of selectivity of Mexican migrants in terms of unobserved characteristics.
Similarly, the results from equations (1) and (3) are compared to obtain evidence of self-selection in terms of observed characteristics. If Mexican immigrants in the U.S. were randomly drawn from the Mexican population in terms of observed characteristics the first components of equations (1) and (3),  and
and  respectively, would be statistically identical, so any significant difference between these two components is interpreted as evidence of selectivity of Mexican migrants in terms of observed characteristics [46-48]. Following this methodology we can assess whether Mexican migrants’ relative health performance in the U.S. would be the same as for the entire Mexican population or if their relatively good health performance in the U.S. is driven in part by being self-selected from their country of origin in terms of observed, unobserved or both sorts of characteristics.
This section starts by presenting the decomposition results that analyze health outcome differentials in cancer, heart condition, hypertension, and diabetes between non-Hispanic Whites (A) and Mexican migrants in the U.S. (B) for adults (age 25-44) and older adults (age 45-64). To consider the potential health selectivity of Mexican migrants in the U.S., this section presents also decomposition results that compare non-Hispanic Whites and the two constructed groups (CB and BC).
The first section of Table 2 presents decomposition results comparing non-Hispanic Whites (A) and Mexican immigrants in the U.S. (B) using the NHIS survey for 2012 for adults and older adults. For both age cohorts, non-Hispanic Whites present higher rates than Mexican migrants for cancer (1.9% and 6.6%), heart condition (2.2% and 6.3%), and hypertension (3.1% and 5.7%), but lower rates for diabetes (-0.8% and -5.2%).
| Adults (age 25-44) Non-Hispanic Whites (A) Compared to: | |||||||||
|---|---|---|---|---|---|---|---|---|---|
| Mexican Migrants (B) | Constructed Group (CB) | Constructed Group (BC) | |||||||
| Explained | Un-explained | Total | Explained | Un-explained | Total | Explained | Un-explained | Total | |
| Cancer | -0.008 | 0.028 | 0.019 | -0.022 | 0.045 | 0.024 | -0.008 | 0.035 | 0.027 |
| Heart Condition | -0.004 | 0.026 | 0.022 | -0.003 | 0.018 | 0.015 | -0.004 | 0.014 | 0.010 |
| Hypertension | -0.025 | 0.056 | 0.031 | -0.033 | 0.073 | 0.040 | -0.025 | 0.081 | 0.056 |
| Diabetes | -0.011 | 0.003 | -0.008 | -0.017 | 0.006 | -0.011 | -0.011 | 0.005 | -0.007 |
| Older Adults (age 45-64) Non-Hispanic Whites (A) Compared to: | |||||||||
| Mexican Migrants (B) | Constructed Group (CB) | Constructed Group (BC) | |||||||
| Explained | Un-explained | Total | Explained | Un-explained | Total | Explained | Un-explained | Total | |
| Cancer | 0.017 | 0.049 | 0.066 | 0.003 | 0.094 | 0.096 | 0.017 | 0.076 | 0.093 |
| Heart Condition | 0.021 | 0.042 | 0.063 | 0.022 | 0.042 | 0.065 | 0.021 | -0.001 | 0.021 |
| Hypertension | 0.034 | 0.024 | 0.057 | 0.040 | -0.126 | -0.086 | 0.034 | 0.090 | 0.123 |
| Diabetes | -0.036 | -0.015 | -0.052 | -0.066 | -0.016 | -0.083 | -0.036 | 0.006 | -0.031 |
Table 2: Decomposition Results Based on Predicted Health Outcomes
The decomposition results present the portion of the difference in predicted health outcomes between groups that is due to observed characteristics (Explained), the portion that is due to unobserved characteristics (Unexplained), and the total difference in predicted prevalence between groups (Total). For adults (age 25-44), decomposition estimates show that most health differences between non-Hispanic Whites and Mexican immigrants for cancer, heart condition, and hypertension are due to differences in unobserved characteristics, while for diabetes most of the difference is explained by differences in observed characteristics.. For older adults, most of the differences in cancer and heart conditions are due to differences in unobserved characteristics, while differences in hypertension and diabetes are explained mainly by differences in observed characteristics. [Among observed characteristics for adults, the main contributing characteristics are differences in educational attainment, weight, height, and family income. Among observed characteristics for older adults, the main contributing characteristics to the difference in diabetes are differences in parental education, age, home ownership, and height].
Source: Own estimations with data from NHIS 2012 and ENSANUT 2012.
Another way to interpret the decomposition results is to consider what would be the effects of having Mexican immigrants with the same unobserved characteristics as the average non-Hispanic White. In this case, the unexplained portion for all decompositions would become zero and Mexican immigrant adults would have higher incidence than non-Hispanic whites for all four health conditions. This suggests that unobserved characteristics play a significant role in determining the relatively good health status of Mexican immigrants in the U.S. when compared to non-Hispanic Whites. A similar analysis for older adults shows that none of the results of the health conditions changes direction when assuming average identical unobserved characteristics for Mexican immigrants and non-Hispanic Whites. Unobserved characteristics have the same directional effect as the observed characteristics [49-50].
Overall, the decomposition estimates using the NHIS data for 2012 show that the HHP cannot be explained by differences in observed characteristics alone. This implies that unobserved characteristics, like genetic endowments, environmental conditions, cultural predispositions, or other characteristics not observed are playing a significant role in explaining disease prevalence differences between non-Hispanic Whites and Mexican immigrants in the U.S. In addition, decomposition estimates show that effects for adults and older adults differ substantially, highlighting the importance of analyzing both age groups independently.
To analyze this issue more in detail, we now consider the possibility that Mexican migrants in the U.S. might be self-selected from the general population in Mexico in terms of observed or unobserved characteristics. The remaining two sections of Table 2 present decomposition results comparing non-Hispanic whites (A) and the constructed groups (CB and BC).
For adults, the explained portion using the constructed group (CB) for most conditions are smaller (more negative) than the results in the first panel, suggesting that Mexican migrant adults in the U.S. might be positively selected in terms of their observed characteristics. In other words, the relatively good health status of Mexican migrants in the U.S. would not be as good if they were randomly selected from the Mexican population in terms of observed characteristics. As an illustration, the explained portion in the first panel of Table 2 could be substituted by the explained portion using group (CB) as the comparison group to show the effects of removing the selectivity in terms of observed characteristics of Mexican immigrants in the U.S. Doing so, Mexican immigrants would have the same observed characteristics on average as the non-migrant population in Mexico and the rate difference in cancer between Mexican migrants and non-Hispanic Whites would be only 0.6% lower for non-Hispanic Whites (-2.2% + 2.8%=0.6%), instead of the current 1.9% (-0.8%+2.8%=1.9%). An analogous analysis for older adults and diabetes would show that the rate difference between Mexican migrants and non-Hispanic Whites would be 8.1% higher for Mexican immigrants (-6.6%-1.5%=8.1%) instead of the current 5.2%.
A similar analysis can be applied to analyze differences in unexplained portions comparing the unexplained portion using the constructed group (BC) and the results in the first panel. For example, the results for cancer in older adults compare 7.6% to 4.9%. Since the results for the constructed group are larger (more positive) than the results in the first panel, this is considered as evidence of negative selectivity of migrants in terms of unobserved characteristics. In other words, the relatively good health status of Mexican migrants in the U.S. in cancer would be even better if they were randomly selected in terms of unobserved characteristics. For example, the rate difference between non-Hispanic White and Mexican migrant older adults in cancer would be 9.3% lower for Mexican immigrants (1.7%+7.6%=9.3%) instead of the current 6.6% (1.7%+4.9%=6.6%).
Table 3 summarizes the selectivity results for each health condition and for both age cohorts. The original estimates correspond to the ones presented in the first section of Table 2, while the Selectivity-Adjusted estimates are obtained using the corresponding constructed groups as comparison groups. The differences between the two are also presented.
| Cancer | Adults | Older Adults | ||||
|---|---|---|---|---|---|---|
| Explained | Unexplained | Total | Explained | Unexplained | Total | |
| Original | -0.008 | 0.028 | 0.019 | 0.017 | 0.049 | 0.066 |
| Selectivity-Adjusted | -0.022 | 0.035 | 0.014 | 0.003 | 0.076 | 0.079 |
| Difference | 0.014 | -0.008 | 0.006 | 0.014 | -0.028 | -0.013 |
| Heart Condition | ||||||
| Original | -0.004 | 0.026 | 0.022 | 0.021 | 0.042 | 0.063 |
| Selectivity-Adjusted | -0.003 | 0.014 | 0.011 | 0.022 | -0.001 | 0.021 |
| Difference | -0.001 | 0.012 | 0.011 | -0.001 | 0.043 | 0.042 |
| Hypertension | ||||||
| Original | -0.025 | 0.056 | 0.031 | 0.034 | 0.024 | 0.057 |
| Selectivity-Adjusted | -0.033 | 0.081 | 0.049 | 0.04 | 0.09 | 0.13 |
| Difference | 0.008 | -0.026 | -0.018 | -0.006 | -0.066 | -0.073 |
| Diabetes | ||||||
| Original | -0.011 | 0.003 | -0.008 | -0.036 | -0.015 | -0.052 |
| Selectivity-Adjusted | -0.017 | 0.005 | -0.012 | -0.066 | 0.006 | -0.061 |
| Difference | 0.005 | -0.001 | 0.004 | 0.03 | -0.021 | 0.009 |
Table 3: Original and Selectivity-Adjusted Decompositions.
Source: Own estimations with data from NHIS 2012 and ENSANUT 2012.
Notes: Difference represents Original minus Selectivity-Adjusted estimates.
Overall, the results in Table 3 suggest that health selectivity of Mexican migrants is playing a significant role for all health conditions. For the most part, the selectivity in terms of observed and unobserved characteristics tends to go in opposite directions, except for hypertension in older adults.
For cancer and diabetes, Mexican immigrants in the U.S. are positively selected in terms of observed characteristics and negatively selected in terms of unobserved characteristics for both age cohorts, although in terms of unobserved characteristics selection is considerably larger (more negative) for older adults. On the other hand, for heart conditions, Mexican migrants in the U.S. are negatively selected in terms of observed characteristics and positively selected in terms of unobserved characteristics for both age cohorts, however, as for cancer and diabetes, in terms of unobserved characteristics selection is considerably larger (more positive) for older adults. Finally, for hypertension, Mexican immigrants in the U.S. are positively selected in terms of observed characteristics for adults but negatively selected in terms of observed characteristics for older adults. Both adults and older adults are negatively selected in terms of unobserved characteristics and again, selection is considerably larger (more negative) for older adults.
Data from the U.S. 2012 NHIS and Mexico’s 2012 ENSANUT was employed to compare four degenerative health conditions between Mexican migrants in the U.S. and non-Hispanic Whites: cancer, heart condition, hypertension and diabetes. Overall, Mexican immigrants in the U.S. tend to be healthier than Mexicans in Mexico in terms of cancer, heart condition, but not in terms of hypertension. In addition, although economically disadvantaged, Mexican immigrants in the U.S. tend to be healthier than non-Hispanic Whites in terms of cancer, heart condition and hypertension, but not in terms of diabetes.
Using an extension of Oaxaca-Blinder decomposition based on disease incidence for non-Hispanic Whites, Mexican immigrants in the U.S. and non-migrants in Mexico proposed by Martinez et al. [1], this paper considers whether Mexican migrants in the U.S. are selfselected in terms of their health conditions or whether their relatively good health performance is a result of general conditions prevalent for all Mexicans. In addition, this methodology allows us to quantify the determinants of such assumed self-selection: selection on observed and/or unobserved characteristics.
Because of health outcomes are expected to change with age, this paper results considers independently two population groups: adults (age 25-44) and older adults (age 45-64). For adults, decomposition estimates indicate that most health differences between Mexican immigrants in the U.S. and non-Hispanic Whites are due to differences in the returns to the observed characteristics (i.e. the unobserved characteristics) (for example: genetics endowments, environmental conditions or cultural predispositions). For older adults, health differences are explained by both observed (for example: height or schooling) and unobserved characteristics.
For adults, the relatively good health status of Mexican immigrants compared to non-Hispanic Whites would be reversed if the unobserved characteristics were identical on average for both groups. For older adults, the effects of observed and unobserved characteristics tend to go in the same direction, suggesting that health outcomes differences for Mexican immigrants compared to non-Hispanic Whites would be significantly smaller if unobserved characteristics were identical on average for both groups.
The approach used in this paper allows us to separate the selectivity process in two categories that operate in different directions. On one hand, the relatively good health status of Mexican immigrants seems to be driven for the most part by positive health selectivity of Mexican immigrants in terms of observed characteristics. However, the relatively good health status of Mexican immigrants would be even better if they were not negatively selected in terms of the returns to such observed characteristics (i.e. the unobserved characteristics).
The evidence presented in this research tells us that selectivity is the main explanation for the HHP only for heart condition, but not for other diseases when analyzing older adults. Although, selectivity is a factor that must be accounted in order to avoid estimation bias in all health outcomes. In specific, selectivity explains 67% of the health advantage for Mexican immigrants in heart condition. In addition, the health advantage for Mexican immigrants is underestimated for cancer and hypertension in 20% and 128% respectively when selectivity it is not corrected.
Selectivity plays a different role for adults (the younger cohort). On one hand, the selectivity process explains 31% and 50% of the health advantage of Mexican immigrants over non-Hispanic Whites on cancer and heart condition, respectively. On the other hand, it does not help to explain the HHP for hypertension and the health disadvantage for diabetes, but not controlling for this issue will generate a bias of 58% and 50% respectively.
One possible element in the unobservable characteristics that might play a relevant role in the negative selectivity process is the differences in the quality of food intakes (or cultural factors positively correlated with health) between Mexican immigrants and non-migrants in Mexico. That is, non-migrants in Mexico might have a healthier diet than those who migrate and adopt a similar diet to non-Hispanic Whites.
Correlation between observable and unobservable characteristics may also have an impact on health differences between migrants and non-migrants, for example, safer working conditions in the U.S. may have a positive impact on income, which consequently will have a positive impact on health. A possible path of research would be to incorporate more characteristics to the analysis, such as the index of relative deprivation or a measure of working conditions, which might increase the percentage of selectivity explained by observable factors. Another future path of research would be to perform the same analysis for mental health measures, in which Mexican immigrants often have better health outcomes than non-Hispanic Whites. Finally, another interesting path of research would be to apply the analysis to the Mexican immigrants that return to Mexico and test the salmon effect hypotheses.
I12, J15, 015.