Research Article - (2025) Volume 14, Issue 1
Given the importance of cell colonization for use in tissue engineering and for studying the inhibition of cancer cells, the use of bio material sculptured nano-structures mimicking the structure of the extracellular matrix offers a unique perspective. In this study, Mn and ZnS sculptured nano-structured fabricated using Oblique (OAD) and Glancing (GLAD) angle vapor deposition methods for investigation of cell behavior. Different characteristics of the produced sculptured thin films of Mn and ZnS materials in form of helical square and 3 and 5-fold helical star shapes were obtained from XRD, FESEM, and AFM analyses. Measurement of contact angle classified the produced samples in two groups of hydrophilic and hydrophobic samples, which provided the opportunity to investigate their function when cultured with normal and cancerous cells. Results showed that the hydrophilic surfaces increased the proliferation of both normal and cancer cells, albeit with different rates. On the contrary, the hydrophobic surfaces prevented the proliferation of cells and their expansion and cells undergo cell death or apoptosis. The specific morphology of the hydrophilic sculptured samples makes it possible to send proliferation signals for tissue engineering purposes, and in hydrophobic samples, to send apoptotic signals to inhibit cancer cells.
Sculptured thin films • Surface wettability • Cell attachment • Cell proliferation • Cancer cells • Apoptotic signals
Control of the action of different cells is an important aim of nano-medicine in scientific fields. The application of hydrophobic and hydrophilic surfaces in studying the function of cells has been reported by many researchers [1]. They can be fabricated using different approaches such as 3D sculptured surface structures as the most used surfaces in this field. The application of nanostructured sculptured thin films with hydrophilic and hydrophobic properties has been reported in numerous other fields, namely, industrial, electronics, optoelectronic, corrosion, Raman spectroscopy, biotechnology and biosensors while their use in nano-medicine is under extensive investigation [2].
The importance of the use of nano-structured sculpture hydrophilic surfaces in changing the shape of cells and formation of certain colonies is emphasized for different applied fields such as biosensors, coroner veins (arteries), cure of wounds, and many other areas. However, the use of nano-structure sculptured hydrophobic surfaces is under investigation in the prevention of cancerous cells from further growth and harnessing their shape (promotion of cell death) [3]. Thin films used for these purposes are nano-scale structures that their different structural features such as void fraction, roughness, grain sizes, and surface energy are all changeable and controllable [4]. Fabrication of different surfaces with different structures for use in this work was carried out using Oblique (OAD) and Glancing (GLAD) angle vapor deposition. These nano-structures consist of morphologies with voids/valleys, peaks, and roughnesses that can act as extracellular matrices. Hence, after processing cell culture, they can move to the edges and porosities of the surface [5]. This causes the uploading of information, which is sent to the nucleus of the cell from the cell membrane as signals [6]. The response of cells to these signals is proliferation, differentiation, production of various proteins, etc. In addition, hydrodynamic and mechanical stresses affect the colonization process [7]. Cells send signals and establish ligandreceptor bonds with local adhesion and proliferation or spread of flopodia on the surfaces to the formation of colonies. This occurs on the surface of hydrophilic surfaces with more energy. Due to the smaller contact angle, air bubbles or grooves are less and it is possible to create a bond between the protein and the surface, and adhesion is established by creating a floppy [8].
Another type of response to the topography is the level of apoptosis signal reception, which is formed due to caspase activity. The response to this signal does not lead to adhesion and proliferation, so reduces the number of cytoskeletons and floppies, which can be due to the unbalance of shear force. On the hydrophobic surface with low surface energy and high contact angle, porosity is higher and air bubbles allow less bonding for proteins. After receiving the apoptotic signal, the cell function deteriorates and then undergoes an abnormal deformation leading to the cell death and suicide [9].
This is a consequence of culturing the cells on the surface of hydrophobic thin films that have double-sided grooves so that the cells are not fed and therefore, without nucleus deformation and the expansion and formation of floppies, they get injured with an abnormal deformity such as shrinkage. It is known that the energy metabolism of cancer cells and normal cells are different. Normal cells produce their energy through mitochondrial oxidation; in contrast, cancer cells produce energy by converting glucose to lactic acid.
In this work, Mn and ZnS helical sculptured structures with square and star-shaped nanostructured cross-sections were fabricated using OAD and GLAD techniques with hydrophobic and hydrophilic natures. Behavior of normal and cancer cells on the produced samples were analyzed for their cell adhesion, viability, morphology, proliferation, and formation of colonies in order to establish their application in tissue engineering and/or controlling cancer cells. Morphology of surfaces was characterized using FESEM and AFM microscope analyses and wettability of surface was characterized by measuring the contact angle. Adhesion of cells on all surfaces was also investigated using FESEM. Results showed that normal and cancer cells proliferate on hydrophilic surfaces with lower void fractions and roughness and cancer cells are able to grow and divide rapidly on hydrophobic surfaces with higher void fractions and roughness, cells growth was significantly restricted, and spherical shape of cells was maintained.
Theory of surface wettability
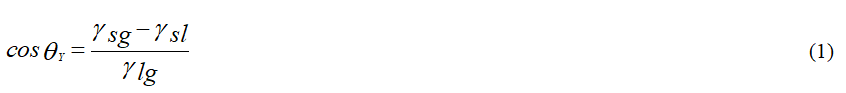
In 1804 Thomas Young reported an equation in which the contact angle between the liquid droplet and the solid surface is related to tensions of solid surface-gas γSg, liquid-gas γLg, solid surface-liquid γSL, as [10]:
As the direct measurement of γSL is not possible it causes some complications in calculation of γ Sg. Different methods are reported for calculation of γ Sg. The method which is being used more often is the acid-base method which is also called the van Oss-Chaudhry- Good method. This method was used in this work in which the total interfacial tension is calculated by summation of polar and apolar component values as:

Where γl is the total interfacial tension of the liquid drop, γLW is the interfacial tension due to Lifshitz-Van der Waals forces, γ+ is the interfacial tension due to electron acceptor component and γ- is the interfacial tension due to electron donor component from acid-base elements [11]. θ is the contact angle and s and l define solid and liquid, respectively. There are three unknown quantities in this equation, namely γLW, γ+ and γ-. In order to obtain their values, one needs to have the contact angles of three liquids with different polarities and known surface tensions, such as α–bromonaphtalene (apolar), water and formamide (polar) (Table 1). Once, the values of these parameters are obtained, then the total surface tension can be calculated using:

| Liquid | γltot | γlLW | γ+ | γ- |
|---|---|---|---|---|
| Bromonaphtalene (apolar) α | 44.4 | 44.4 | 0 | 0 |
| Water (polar) | 72.8 | 21.8 | 25.5 | 25.5 |
| Formamide (polar) | 58 | 39 | 2.28 | 39.6 |
Table 1. Components of surface tension at room temperature (mJm-2).
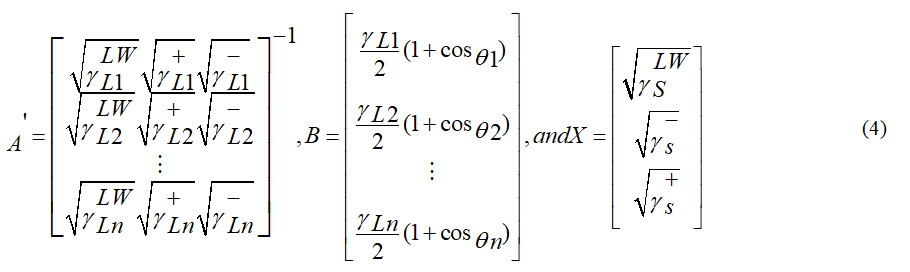
Equation 2 can be re-written in form of a matrix and can be solved for any number of liquids and obtain the unknown parameters:
Lewis short-range acid-base interaction tension is given as:

Finally, the free surface energy can be obtained from summation of short range and long range tensions as:

This energy is one of the basic parameters in distinguishing that whether the surface is hydrophilic or hydrophobic. Surfaces with low or high surface free energy are identified as hydrophilic or hydrophobic surfaces, respectively.
Equation 7-9 give the relationship of works of adhesion Wa, continuity Wc and spreading Ws, and the dependence of these values on the contact angle of water droplet on solid surface and water total surface tension:
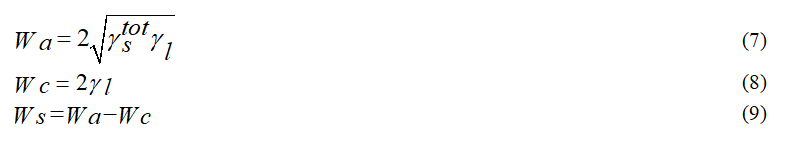
Work of adhesion is a measure of sticking power between two phases. Hence, the probability for sticking of surfaces with low surface free energy and low work of adhesion is low. Hydrophobic surfaces show low values for work of adhesion and work of spreading while high values of these two parameters show hydrophilic behavior of the surface.
The hysteresis of contact angles of the liquid drop with solid surface is the other parameter that can be used to identify the surface as an adhesive or otherwise. This is obtained as the difference between advancing and receding contact angles (θhys=θadv-θrec). In practice, the advancing and receding contact angles are measured by releasing a droplet of 10 mg on the substrate surface and by pumping in and out of a further 30 mg of liquid in this droplet, respectively. A value of more than 20 degree for the hysteresis is indicative of high adhesion.
Furthermore, laplace pressure ΔP (Pa) is the other parameter from which one may identify the higher or lower contact angle of droplet on the solid surface. The higher and lower values of Laplace pressure are inversely related to the contact angle. Laplace pressure ΔP (Pa) is given as:
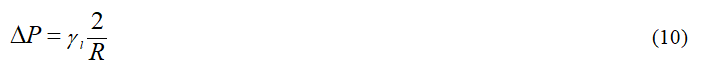
Where, R (mm) is the radius of the droplet on the surface which can be calculated from:

Preparation of sculptured thin films
Manganese (Mn) and Zinc sulfide (ZnS) (99.95% purity, Goodfellow metals, Cambridge Ltd., UK) sculptured thin films were produced using Oblique (OAD) and Glancing (GLAD) techniques at different angles (Table 2) by Physical Vapor Deposition (PVD) (Edwards E19 A3) plant equipped with electron beam gun and Quartz Crystal Oscillator Monitor (QMC) (Sigma instruments, SQM-160, USA). The deposition rate was 1 Ås-1 and the base pressure of the system was 2 × 10⁻⁷ mbar. Glass microscope slides (Bavaria medico, Germany) cut to 20 × 20 mm2 with a root mean square surface roughness of 0.3 nm and 0.9 nm measured by talysurf profilometer and Atomic Force Microscope (AFM), respectively were used as substrates. In addition, copper substrates of the same size obtained from (Goodfellow metals, Cambridge Ltd., UK.) with a root mean square surface roughness of 3.59 nm were also used. All substrates were subject to cleaning through process of heated ultrasonic bath by acetone and absolute ethanol, respectively, before being stuck on the substrate holder (a stainless steel disc of 100 mm in diameter) using double sided vacuum carbon sticking tape which was then mounted on the rotating mechanical feedthrough inside the deposition chamber. The substrate holder system is controlled by two stepping motors, which can rotate the substrate holder by two angles, the vapor incident angle (α) and rotation of the substrate about its surface normal (φ), with 0.01°/step accuracy and with controlled speed. The movement of the stepper motor for rotation of substrate about its surface normal (φ), its speed of revolution and the facility for dividing each revolution into different sectors are controlled through interface to a computer in which the related software (in the LABVIEW format) is written and installed [12]. In order to fabricate the helical structures with square cross-section, after deposition of each arm the substrate holder was rotated by 90°. Fabrication of helical star-shaped nanostructures took place as described in the Appendix of our earlier publication. The distance between the crucible a nd the center of the substrate holder was 30 cm. QMC was positioned close to the substrate holder and at the same angle chosen for the deposition. This gives a good estimate of the film thickness and the deposition rate. In this arrangement the vapor source (6 mm in diameter) behaves like a point source with a cosine distribution and because of the 30 cm distance between the vapor source and substrate, it is expected that the vapor has straight trajectories (i.e., no appreciable scattering due to the large mean free path (103-104 cm) occurs). The deposition process was repeated a few times, and the reproducibility of the results was confirmed by different analysis techniques, which were used for the characterization of the produced nanostructures (i.e., X-Ray Diffraction (XRD), Field Emission Scanning Electron Microscope (FESEM), Atomic Force Microscope (AFM) analyses).
Tait equation may be used for obtaining the columns growth angle with respect to the normal to the substrate surface normal (β) for the case when the deposition angle (α) is larger than 60° as:
| Sample | Deposited material | Deposition angle | Nanostructures | Arm length and no. of arms | Film thickness (nm) |
|---|---|---|---|---|---|
| A1/glass | ZnS | 83.4° | Helical square | 120 (3), 100 (2), 80 (2), 60 (2), 40 (2), 30 (2), 20 (3) | 403 |
| A2/glass | Mn | 84° | Helical square | 40 (3), 30 (2), 20 (2) 15 (2), 12.5 (2), 10 (3) | 274 |
| A3/Cu | Mn | 87° | Helical square | 40 (3), 30 (2), 20 (2), 15 (2), 12.5 (2), 10 (3) | 256 |
| B1/Cu | Mn | 80° | 3-fold Helical star | 60, 30, 15 | 368 |
| B2/Cu | Mn | 80° | 5-fold Helical star | 60, 30, 15 | 707 |
Table 2. Details of deposition of samples and their structures.
Characterization of fabricated sculptured thin films
Field emission scanning electron microscopy (FESEM, FEI NOVA NANOSEM 450) was used to examine the physical nanostructure and hence the film thickness. Samples produced on glass substrates were coated with a thin film of gold to prevent the charging effect. AFM (Park scientific instruments model autoprobe, NT-MDT, scanning probe) was employed to obtain the surface physical morphology and roughness with a Si tip of 10 nm in diameter and in non-contact mode. Crystallographic structure of the produced samples was obtained using a Bruker D8 x-ray diffractometer (Cu Kα radiation), Germany, with a step size of 0.02°.
Contact angle and contact angle hysteresis
Different angles required for wettability analysis of the samples (i.e., static, advancing, receding and the hysteresis) were obtained using a domestic made instrument with a 5-dioptre lens and digital camera (model DCR-SR200E, Sony, Japan). A droplet of 10 mg of three different liquids of different polarities ((i.e., α-bromonaphtalene (apolar), formamide and distilled water (polar)) were initially released smoothly on the surface of the samples. The advancing and receding contact angles were measured by pumping in and out of a further 30 mg of liquid in this droplet, respectively. The hysteresis of the contact angle was obtained as the difference between advancing and receding contact angles. ImageJ software code and the method of Low Bond Axisymmetric Drop Shape Analysis (LB-ADSA) was used for the Young–Laplace analysis. This code uses the droplet image on the solid surface and measures the contact angle by precision of two digits. The average of contact angles of several droplets on reproduced samples was used to obtain the contact angle and calculate the uncertainty of the data. Then these values were rounded to one digit.
Cell culture and measurement of average size and adhered cell-covered area
HEK293 cells and neuroblastoma cancer cells (10000 cells per well) were seeded on hydrophilic and hydrophobic surfaces and cultured in DMEM medium containing 10% Fetal Bovine Serum (FBS, invitrogen), 1% penicillin/streptomycin (100 U ml-1, invitrogen), 1% glutamine (2 mM) and 1% of unnecessary amino acids (100x). Normal cells were incubated for 4 and 10 days, and cancer cells were incubated for 2 and 4 days at 37â in a humidified 5% CO2 incubator.
For observation of adhered cells, the medium was removed and the cells were washed with Phosphate-Buffered Saline (PBS, pH 7.4, invitrogen). Cells were then fixed with 4% paraformaldehyde solution for 30 to 45 minutes (at room temperature) followed by three distilled water washes, cells were stained with fluorescent colors including 0.05% (w/v) crystal violet (Sigma) for 2 minutes and fluorescent 4′,6- Diamidino-2-Phenylindole (DAPI). The stained cells were observed using a fluorescence microscope (Zeiss Axiovert 200; Carl Zeiss Inc., Thorn-wood, NY, USA) in at least 4 areas for each sample. The obtained images were analyzed with ImageJ software (Version 1.46, NIH, Bethesda, MD) to quantify the percent of the cell-covered area and average size of the cells.
Observation of the cell adhesion using FESEM
In order to prepare FESEM samples for observing the morphology of the adherent cells, the medium was removed and the cell/ (nanostructures) constructs were washed with Phosphate-Buffered Saline (PBS, pH 7.4, Invitrogen). Next, the cells were fixed in 2.5% glutaraldehyde solution (Sigma) at room temperature for 1 h. The excess glutaraldehyde was then removed by washing with PBS and nanostructures were dehydrated using multistage ethanol solutions (30, 50, 80, and 99%). The cells were dried in air for 24 h to remove the solution. Thin layer of gold, was coated on cultured samples for taking pictures by the FESEM microscope.
Statistical analysis
Student's t-test and ANOVA, were used to investigate the difference between groups and P<0.05 was considered significant. In each group, at least three replications were carried out.
FESEM, AFM and contact angle analyses
FESEM images of different samples produced in this work are given in Figure 1. The growth angles of the arms of the nanostructures were obtained using ImageJ software from which the length and the thickness of sample can be obtained (Table 2). The inserts in each subfigure gives the water droplet image on these surfaces from which the contact angle was determined by means of ImageJ software. The grain size (in case of nano-rods the top of the rod (thickness of arms)) increases with respect to length and as the sculptured structures in this work develop the final feature increases in size. This is consistent with the predictions of the Structure Zone Model (SZM) [13]. Messier et al. revised the SZM, by using SEM, TEM and FESEM, and suggested an evolutionary growth development of physical structure, in which column/void sizes are assigned as five sub-zones with sizes: 1–3, 5–20, 20–40, 50–200, and 200–400 nm. This shows that each level of physical structure is about a factor of 3 larger than the previous level. Furthermore, messier in an attempt to quantify morphology of thin films at low adatom mobility, proposed a fractal model that results from natural clustering during random ballistic aggregation of atoms. Savaloni et al. also found that by increasing the film thickness the grain size increases, while it’s morphological and crystal structure also change. B2/Cu sample has the highest film thickness resulting from the higher number of sharp points in the star-shaped structure, hence higher number of pitches (turns in the helical structure). Similarly, apart from A3/Cu sample, the other samples follow this argument while the low thickness of A3/Cu sample can be related to the larger growth angle of arms (β).
The FESEM images (Figure 1) of both helical square and starshaped sculptured structures show that the a rm length is reduced from bottom to the top of the film in each pitch/turn, which is consistent with our design and fabrication of these engineered sculptured structures. In addition, the growth angle of arms is shown on these images which are in agreement with the prediction of the Tait equation (equation 12).

Figure 1:FESEM images of Mn and SZn helical square and star shape samples together with the images of droplet on their surfaces (insets); (a): A1/glass; (b): A2/glass; (c): A3/Cu; (d): B1/Cu and (e): B2/ Cu.
Two dimensional (2D) and three dimensional (3D) AFM images and the surface void fraction images of the produced samples are given in Figure 2 columns I to III, respectively. The 2D AFM images were used with application of JMicroVision and WSxM Codes to obtain grain size distribution, root mean square (Rrms), average (Rave) surface roughness and surface void fraction of these films which are given in Table 3. It should be mentioned that as these results are obtained from the 2D images of the samples, the grain sizes should reflect the size of the surface view of the arm of the top pitch/turn (shortest arms). Arrows on the 2D images of the samples (Figure 2, column I) show the growth orientation of these helical structures with different symmetries.
| Sample | Deposited Material | Nanostructure | Columns angle (°) | DAFM (nm) | Rave (nm) | Rrms (nm) | S-V (%) | Contact angle (°) |
|---|---|---|---|---|---|---|---|---|
| A1/glass | ZnS | Helical square | 56.8 | 134 | 7.8 | 9.9 | 30 | 60.2 |
| A2/glass | Mn | Helical square | 57.4 | 75 | 8.6 | 10.8 | 30 | 63.6 |
| A3/Cu | Mn | Helical square | 58.9 | 130 | 16.3 | 19.9 | 35 | 140.1 |
| B1/Cu | Mn | 3-fold Helical star | 56 | 61.5 | 9.2 | 12 | 38.5 | 131.1 |
| B2/Cu | Mn | 5-fold Helical star | 56 | 84.3 | 11.5 | 15.5 | 40 | 135.2 |
| Note: S-V: Surface void fraction | ||||||||
Table 3. Results obtained from AFM, FESEM and contact angle measurement.

Figure 2:AFM images of the Mn and ZnS helical square and star shape samples; Column I: 2D images; Column II: 3D images; Column III: Void fraction. (a): A1/glass; (b): A2/glass; (c): A3/Cu; (d): B1/Cu; (e): B2/Cu.
The obtained surface void fraction for A1/glass and A2/glass are the same while they are of different thicknesses. This can be related to the larger size distribution of A1/glass sample (Figure 2a) and the more homogenous size distribution of smaller grains of A2/glass sample (Figure 2b). The higher surface roughness of the A3/Cu (Figure 2c) sample relative to A1/glass and A2/glass samples can be due to the initial rougher surface of the Cu substrate (3.59 nm) relative to the glass substrate (0.3 (Talysurf measurement) or 0.9 nm (AFM measurement) and the larger deposition angle of the A3/glass sample.
XRD analysis
In Figure 3 the spectrum (a) shows the XRD plot of A1/glass (ZnS helical square) sample. A strong peak is obtained at 2θ=28.83° which according to the data from JCPDS card No: 01-080-0007 can be related to ZnS (002) orientation. Considering that the other peak in this spectrum at 2θ=43.44° that accordingly belongs to ZnS (202) direction is of very low intensity, one may suggest that this sample is grown preferentially in (002) direction of ZnS. Spectrum (b) in Figure 3 shows the XRD pattern of A2/glass (Mn helical square) thin film. Considering that, the film is deposited on glass substrate with porous structure a nearly amorphous pattern is also obtained for the deposited thin film with three weak peaks and a hump between 60 and 80 degrees. The three peaks are formed at 41.18°, 51.44° and 56.74° degrees which according to the JCPDS cards nos: 00-007-0222 and 00-017-0910 can be related to MnO2 (210), Mn (002) and MnO2 (240), respectively. The reason for the difference observed between a and b spectra in Figure 3 though both are of helical square shape can be due to the shorter arm lengths (one third) and hence thinner structure of A2/glass film relative to the A1/glass sample as well as the type of deposited materials. All of these parameters can be responsible in reducing the x-ray scattering power.
XRD results related to the samples (i.e., A3/Cu (helical square), B1/ Cu (3-pointed helical star-shaped and B2/Cu (5-pointed helical starshaped)) deposited on Cu substrates are given in Figure 4. Four diffraction lines belonging to the Cu substrate are present in all of the subfigures in Figure 4 as Cu(111)(2θ=43.31°), Cu(200)(2θ=50.46°), Cu(220)(2θ=74.14°) and Cu(311)(2θ=89.93°) which were assigned using the JCPDS card no: 01-085-1326. The spectrum of A3/Cu in Figure 3 shows that the peak at 50.46° is highly increased in intensity after deposition of Mn helical square film while at 43.31° where Cu(111) was detected a small change in the intensity is occurred. By checking all the available JCPDS cards for both Mn and different phases of Mn oxide it was found that the negligible increase of peak intensity at lower angle (Mn2O3 JCPDS card no: 00-002-0909: 2θ=43.254°) may be related to (Mn2O3) (-221) and the increase in the intensity of peak at 50.46° should be due to formation of MnO2 (32°C) according to the JCPDS card no: 01-082-2169, 2θ=50.376°. This result shows that the latter phase of Mn oxide is preferentially formed during deposition of this sample. Comparing this observation with the result of A1/glass (ZnS helical square) sample which again showed the growth of ZnS (002) preferred orientation it may be suggested that due to the 4-fold symmetry of square shape of these structures the probability of formation of preferred orientation is highly increased. This can provide information for production of single crystals.
The XRD of the star-shaped samples as 3-pointed (B1/Cu) and 5- pointed (B2/Cu) in Figure 4b and c also show some increase of intensity on top of Cu peaks which vary with the thickness and symmetry of these structures that can be related to the Mn oxide phases as assigned on these figures according to the JCPDS card nos: 01-082-2169, 00-002-0909 (Figures 3 and 4).

Figure 3:XRD patterns of ZnS and Mn helical square shaped sculptured structures deposited on glass substrates. (a): ZnS/glass (A1/glass); (b): Mn/glass (A 2/glass).

Figure 4:XRD patterns of; (a): Cu helical square shaped sculptured structure (A3/Cu); (b): Cu helical 3-pointed star shaped structure (B1/ Cu);(c): Cu helical 5-pointed star shaped structure (B2/Cu), deposited on Cu substrate. In a, b and c subfigures, gray pattern belongs to uncoated Cu substrate and black pattern belongs to the Cu sculptured thin film deposited on Cu substrate.
Results of hydrophobicity, hydrophilicity and wettability
Results obtained for different parameters of hydrophobic/ hydrophilic behavior of different samples produced in this work including contact angle for three different liquids used, advancing θadv, receding angles θrec, hysteresis contact angle ΔθHys, the interfacial tension due to Lifshitz-Van der Waals γslw approach proposed by van Oss-Chaudhry-Good, the interfacial tension due to electron acceptor, γs+, the interfacial tension due to electron donor γs-, the polar component of Lewis acid-base interaction γAB, surface free energy γstot, work of adhesion Wa (mJm-2) work of spreading Ws and Laplace pressure ΔP are given in Table 4.
Surface roughness and surface free energy both have direct influence on the hydrophobicity [14]. In Table 4, it can be seen that apart from A1/glass and A2/glass samples the rest of the samples irrespective of the shape of the deposited sculptured structure on the substrate (i.e., Cu) show hydrophobic property which can be somewhat due to the surface roughness of the substrate compared to the glass substrate used for A1/glass and A2/glass samples. Results obtained for A1/glass and A2/glass samples show hydrophobic behavior despite the fact that the deposited materials are different (i.e., Mn and ZnS). Hence, the smooth glass surface has been responsible for the low contact angle (hydrophilic) of these samples. Fabrication of hydrophobic surfaces has been through using deposition or etching as well as other methods. Savaloni and Esfandiar in order to both enhance the surface roughness and achieve crystallographic facets with possible low surface free energy (i.e., Ag (111) diffraction line) used the layer by layer deposition technique to produce graded chiral zigzag nano-sculptured Ag thin films.
In Table 4 it can be seen that the value obtained for hysteresis angle using the method described in section 2 for all samples produced in this work is above 20 degrees. Hence, all samples according to the definition in the literature should show high adhesion, while the value obtained for the A3/Cu sample is highest which also shows the highest contact angle (hydrophobicity). Therefore, it may be suggested that samples produced in this work are behaving as sticky surfaces (rose petal effect) [15].
In addition, the spreading coefficient can be calculated according to equation 9, section 2. The values obtained for different samples are given in Table 4 as Ws and it can be observed that all of them are negative with the largest negative value for A3/Cu sample as 68.4. This again confirms that samples of this work and in particular A3/ Cu can be classified as sticky surfaces.
| Sample | θSCA (°) | θα-b (°) | θfor (°) | θadv (°) | θrec (°) | θhys (°) | γslw | γs+ | γs- | γAB | γstot | Wa | Ws | R (mm) |
|---|---|---|---|---|---|---|---|---|---|---|---|---|---|---|
| A1/glass | 60.2 | 16 | 58.8 | 106.2 | 86.1 | 20.1 | 42.8 | 0.46 | 16.4 | 5.5 | 48 | 117 | 27.7 | 2.9 |
| A2/glass | 62.6 | 18 | 62.4 | 112.6 | 91.6 | 21 | 42.3 | 0.74 | 27.6 | 9.1 | 51 | 122.2 | 23.4 | 3 |
| A3/Cu | 140 | 77.5 | 98.8 | 109.7 | 80.1 | 29.5 | 16.2 | 0.31 | 11.6 | 4 | 20 | 76.5 | 68.4 | 5.3 |
| B1/Cu | 131.1 | 61.3 | 97.9 | 137.1 | 117 | 20.4 | 24.1 | 2.1 | 2.1 | 4.1 | 28 | 90.5 | 55.1 | 5.1 |
| B2/Cu | 135.3 | 66.1 | 88.1 | 141 | 121 | 20 | 21.9 | 0.08 | 8.3 | 1.6 | 23 | 80.1 | 65.6 | 5.5 |
Table 4. Details of data obtained from hydrophobicity analyses/measurements for the samples discussed in this work.
The other parameter, which is important in identifying the hydrophobic behavior of a surface, is the three phases stress in Laplace pressure, because the radius of the droplet on the surface depends on the interface line between these three phases. The Laplace pressure imposed on the curvature of water droplet dependence on the length of the interface line for a fraction of solid material, R (mm). The shorter is this line the higher is the probability of transition from Cassie-Baxter state to Wenzel state. According to the data in Table 4, the Laplace pressure obtained for A3/Cu sample is 27.6 Pa, which is lower than that for the other samples examined in this work. The Laplace pressure is a measure of the activation/exciting force for the transition and the higher its value the higher is the probability of Cassie-Baxter state to Wenzel state transition.
Kustandi et al. reported that the Laplace pressure reciprocally dependence on the radius of the water droplet. The obtained data for the samples of this work are given in Table 4 for these two parameters and are in agreement with.
The values obtained for work of adhesion and work of diffusion for all samples are also given in Table 4 and show that those belonging to A3/Cu sample are the lowest, which are in agreement with the higher hydrophobic behavior of this sample relative to the other samples discussed in this work. Results of the samples produced in this work discussed in this section show that the helical square sculptured structures behavior is similar to both gecko feet and rose petals. They are acting like gecko feet which show high liquid-solid adhesive forces where the responsible factor is the hierarchical structure of gecko foot-hairs that starts from the micrometer-scale stalks (5-10 mm in diameter and 70-100 mm in length) and go down to the 100-200 nm diameter spatula stalks by branching. At the very ends of spatula stalks, there are thin leaf-like plates about 300–500 nm width, also known as spatula [16].
Hence, the Mn/Cu helical square sculptured thin films reported in this work not only show hydrophobic property but also are of high adhesion property with the highest being for the A3/Cu sample.
Cell culture results
Morphology of normal HEK (293) cells (Figure 5a and b) on the hydrophilic and hydrophobic surfaces was observed using FESEM after 4 and 10 days of culture, as well as neuroblastoma cancer cells after 2 and 4 days of culture (Figure 6a and b). The average size and percent area covered by cells and cell colonies were obtained using FESEM images and Image J software (Figure 7a and b).

Figure 5:Images of culture of normal HEK (293) cells for (A) 4 days and (B) 10 days on a glass coverslip, hydrophilic and hydrophobic surfaces. (a): Fluorescent microscopy; (b): FESEM images; from the (I) control sample surface (glass coverslips), (II) hydrophilic sample A1/glass, and (III) hydrophobic samples (A: A3/Cu, B: B2/Cu).
According to the Figure 5a the values of the average size of colonies and percent area covered by cells on the control sample (Figure 5a, I)) and hydrophilic surface (Figure 5a, II and Figure 7) it can be seen that normal cells on the hydrophilic surface (contact angle of 60.16° (Table 4)) have better adhesion and created large colonies of 4.1 μm average size after 4 days of culture (Figure 7a). Previous studies have shown that the micro-sculptured structures control the transport of nutrients and the growth of colonies. In addition, cells are able to synthesize extracellular matrix components in response to the different physical and chemical signals from the surrounding 3D matrix. Adhesion, proliferation, and separation can be a response to signals. The high surface free energy obtained for the A1/glass sculptured sample can be responsible for the large values of adhesion and spreading of cells (Table 4). The morphology of this surface, with a void fraction of 30% and 9.96 nm roughness, changes the polymer state of the actin and cytoskeletons, leading to cell adhesion and colonization. Lampin et al. reported that surface morphology as a culture area can promote or stop the reaction of cells and can be designed for improving tissue repair. Most importantly, the dimensions, roughness, and structure of the surface are associated with the super-molecular structure of extracellular matrix proteins, such as fibrinogen and collagen.
Filopodia extension in the control sample (glass coverslip) is observed at 10 days of culture (Figure 5b, I). Growth of colonies can clearly be observed on the A1/Glass sample surface (Figure 5b, II). These colonies are flatter than colonies formed after 4 days and are spread around. Li et al. have reported that over time the cells become wider and broader. In Figure 7b, it can be seen that the normal cells occupied 5.4% of A1/Glass hydrophilic sample when cultured for 4 days. This observation shows that the increase of time lapse from 4 days to 10 days has a direct effect on the occupied space by cells and normal cells proliferate on the control and hydrophilic surfaces over time (Figure 5b, I,II)). The average size of the colony expanded on the control sample, and hydrophilic surface reaches 2.7, and 4.2 μm, respectively (Figure 7a). The interaction of cells with walls and surface roughness causes local biomechanical deformation so activates signals that regulate cell growth and differentiation. Lampin et al. showed that the highest amount of cell adhesion occurs on surfaces with relative hydrophilic property, and their high-surface free energy can lead to better adhesion of cells. The performance of hydrophilic sculptured samples on normal cells and creating different colonies in terms of size, extent, and shape can be used in tissue engineering [17].
Due to the weak adhesion of the hydrophobic surfaces, the possibility of colonization or spread of cells is not in accordance with hydrophilic surfaces. Compared to the normal HEK cells in the control group, filopodias around the cells on the hydrophobic surfaces are removed and the cells are less spread (Figure 5, III). The growth and proliferation rate of cells on these surfaces is reduced by time relative to the hydrophilic surfaces in agreement with. The average size of the cells and the percent area covered by cells on the hydrophobic surfaces decreased compared to the control group and hydrophilic surface (Figure 7a and b). Pan et al. reported that deformation is an indication of the loss of cell function. The high contact angle of these surfaces, high roughness, high porosity and low surface free energy (Tables 3 and 4) can prevent adhesion and spread of cells and cell nutrition and growth.
Cells did not stick on the hydrophobic surface (i.e., B2/Cu sample) with a surface roughness of 15.5 nm and surface free energy of 23 (mJm-2). The surface roughness and closed spaces of this surface limit the nutrition of the cells and prevent their extension and proliferation. According to Figure 7a, the average cell size is 0.5 μm and the percent area covered by cells is 0.45% after 10 days of culture, indicating that the covered area in the hydrophobic surface has reduced compared to the control group, and cells are seen separately on this surface. Their shape has remained spherical; filopodia are completely removed, and colonies are not formed. Compared to the normal cells cultured on the hydrophilic surface (Figure 5b, II), the average size and the amount of cells are decreased on the hydrophobic surface (Figure 5b, III), limiting the size of the cells and preventing their performance which resulted in controlling their proliferation and growth and lead to death. Pan et al. indicated that a specific array of nanodots hydrophobic surface with high roughness reduces cytoskeletal and cell adhesion, produces apoptotic signal and leads to cell death.

Figure 6:Neuroblastoma cancer cells cultivated for (A) 2 days and (B) 4 days on a glass coverslip, hydrophilic and hydrophobic surfaces. (a): Fluorescent microscopy images; (b): FESEM; from (I) control sample surface (glass coverslip), (II) hydrophilic sample (A2/ Glass) (III) hydrophobic samples (A: A3/Cu, B: B1/Cu).
Clark et al. reported that cancer cells become proliferated and more dispersed over normal cells. In our study, the average size of the cells on the control sample is 2.3 μm, and the ratio of cell covered area is 2.1% after 2 days of culture (Figure 7a and b). According to the properties of cancer cells, they tend to have great adhesion, distribution and proliferation. The cell-covered area is 5% on the hydrophilic surface, and due to the surface morphology, colonies form with an average size of 3.21 μm (Figure 7a). As seen from the results, cancer cells have responded to the hydrophilic surface with the creation of smaller colonies, but with more cellcovered area percent than normal cells on until in the time lapse of 4 days. Spreading of cells on the whole surface is visible in Figure 6a, II. Justification of this phenomena can be attributed to the proliferation of cancer cells on the hydrophilic surface with moderate roughness, which can quickly be divided and grow, while the growth of normal cells is stopped by receiving the signal from the opposite cells. In a study of the adhesion behavior of cancer cells by Ko et al. spreading of cancer cells is observed on the hydrophilic surface. Cancer cells occupy a large area of hydrophilic scaffolds due to their surface morphology and roughness, which results in increased cell adhesion.
Over the time-lapse of the 4 days of culture (Figure 6b), the average size of cells on the control sample is 2.7 μm, and occupied space is 2.68%. The cancer cells cultured on the A2/Glass hydrophilic surface have an average size of 3.44 μm and a covered area of 5.2% (Figure 7a and b). It was observed that in the case of normal cells, with increasing covered area, the proliferation and expansion of the cells have occurred. This suggests that the aging of normal cells leads to proliferation and spreading, while in the case of cancer cells, proliferation and separation are observed [18].
In (Figure 6a, III), it can be seen that there is no accumulation and formation of colonies on this hydrophobic (A3/Cu) surface as a result of reduced adhesion and spreading of cancer cells which are in turn due to its surface morphology parameters (Table 3).
Keeping the initial form of cells indicates the loss of cell function. In Figure 7a and b, the average size of the cancer cells on the control sample is 2.3 μm, and the occupied space is 2.1%. On the hydrophobic surface, the average size of 0.2 μm was calculated, which occupies the space of 0.23%, which decreased compared to the control sample. When air bubbles are in the surface areas, the protein bond is stopped and prevented from proliferation. This abnormal form is known as an apoptosis signal [19].
Due to the low surface free energy of the hydrophobic surface, cell adhesion is less, and cells have remained in a circular shape over time. The ratio of the cell-covered area is reduced, and this condition is due to a decrease in the adhesion and absorption of the cell surface proteins. The average size of cells on the control sample (glass coverslip) is 2.7 μm, and the covered area is 2.68%, while these values on the hydrophobic surface are 0.18 μm and 0.1%, respectively (Figure 7a and b) after 4 days of cultivation. The covered area and size of the cancer cells are greatly reduced on the hydrophobic surface, leading to cell death through apoptosis [20].

Figure 7:The average size (a) and the percent area (b) covered by the normal HEK cells (293) and neuroblastoma cancerous cells cultured on various hydrophilic and hydrophobic scaffolds, in different periods of
time. (Control: glass coverslips, 1N: Normal cells at 4 days, 2N: Normal cells at 10 days, 1C: Cancer cells at 2 days, 2C: Cancer cells at 4 days).
The effect of produced sculptured nanostructures with the OAD and GLAD methods with different morphologies and wettability (contact angles between 60.2° to 135.2°) were studied using FESEM, AFM, XRD, and CA. After culturing normal and cancer cells on different sculptured nanostructures, results obtained from FESEM and fluorescent microscope images showed that the difference in surface roughness and porosity influence the adhesion and growth of both type of cells. Sculptured hydrophilic nanostructures, by the provision of appropriate topography, send different signals to cultured cells that improve the growth and proliferation of cells and can be used for tissue engineering applications. Considering the satisfactory adhesion and proliferation of normal cells, formation of colonies and their separation on the hydrophilic surfaces, it may be suggest that these hydrophilic surfaces can be used in shaping and repairing various tissues with increased percent area covered cells. On the other hand, hydrophobic nanostructures led to the inhibition and elimination of neuroblastoma cancer cells with decreased percent area covered cells. The hydrophobic nanostructures can prevent the progression of cancer cells and disrupt their function due to their surface roughness, surface contact angle, and surface-free energy.
This work was carried out with the support of University of Tehran and Department of Tissue Engineering and Applied Cell Sciences, Shahid Beheshti University of Medical Sciences.
This work was supported by Univesity of Tehran and the Shahid Beheshti University of Medical Sciences.
The authors declare that they have no known competing financial interests or personal relationships that could have appeared to influence the work reported in this paper.
All methods were performed in accordance with the relevant guidelines and regulations (IR.SBMU.RETECH.REC.1401.104).
F.FS and H.S wrote the main part of the manuscript text. H.Z and Z.N wrote the cell section of the manuscript text. F. FS prepared all figures. H.S fabricated all the samples. F.FS analyzed all the samples. H.S reviewed the manuscript.
The data of the results presented in this work are available on reasonable request from the authors of the paper.
[Crossref] [Google Scholar] [PubMed]
[Crossref] [Google Scholar] [PubMed]
[Crossref] [Google Scholar] [PubMed]
[Crossref] [Google Scholar] [PubMed]
[Crossref] [Google Scholar] [PubMed]
[Crossref] [Google Scholar] [PubMed]
[Crossref] [Google Scholar] [PubMed]
[Crossref] [Google Scholar] [PubMed]
[Crossref] [Google Scholar] [PubMed]
[Crossref] [Google Scholar] [PubMed]
[Google Scholar] [PubMed]
[Crossref] [Google Scholar] [PubMed]
Citation: Savaloni H, et al. "Design and Fabrication of Sculptured Thin Films for Application in Control of Cancer and Other Cells". Biol Todays World, 2024, 13(4), 1-9.
Received: 17-Jul-2023, Manuscript No. JBTW-23-110251; Editor assigned: 19-Jul-2023, Pre QC No. JBTW-23-110251 (PQ); Reviewed: 02-Aug-2023, QC No. JBTW-23-110251; Revised: 03-Feb-2025, Manuscript No. JBTW-23-110251 (R); Published: 10-Feb-2025, DOI: 10.35248/2322-3308.25.14(1).003
Copyright: © 2025 Savaloni H, et al. This is an open-access article distributed under the terms of the Creative Commons Attribution License, which permits unrestricted use, distribution, and reproduction in any medium, provided the original author and source are credited.