Research - (2019) Volume 1, Issue 1
In Rwanda, the government has done a lot for its population to access the health services easily. However, it is one of the African countries with the high rate of people with health insurance through Community health service 96% of the population and overall health insurance possession is around 74%. Despite all efforts and high rate of health coverage in general there exist some gaps caused by an increase of out of pocket medical expenditures which might lead to delays of accessing medical health care. However, one of the ways of handling this issue is to predict the out of pocket medical expenditures with accuracy.
Moreover, machine learning algorithm have not been sufficiently used previously to predict the future health care cost in Rwanda by considering zero health cost, thus the lack of the efficient method to be used to predict future health care cost of household in Rwanda is a big challenge for the patients and decision makers. It is in this regard that our paper aimed to predict the out of pocket medical expenditures in Rwanda using machine learning approaches and compares the results using four machine learning approaches such as Random Forest, Decision tree Models, Gradient Boosting, Regression tree models. The data to use for this analysis was collected from National Institute of Statistics (NISR) that is the Integrated Living Conditions Survey 2016-2018 (EICV5). However, this nationally representative survey gathered data from over 14580 households and representing 64314 individuals throughout the country. Information was collected at the household and the individual level. Household level information such as the out-of-pocket health expenditures including: consultation; laboratory tests; hospitalization; Diabetes, blood pressure, and other illness and medication costs. Decision tree Train accuracy was: 65% and Test accuracy was 67%, Random Forest Train accuracy was 77% and Test accuracy was 68% and gradient boosting was selected as the best model because the Train accuracy was 78% and Test accuracy was 85%, a variable total consumption played a significant role in the model up to 59.15%.
However, the findings proved that suggest that medical expenditures are significantly correlated with the total consumption and ages and shows that there is significant correlation in health care expenditures. Machine learning models can help to accurately forecast the expenditures. These results could advance the field toward precise preventive care to lower overall health care costs and deliver care more efficiently. Moreover, for health insurers and increasingly healthcare delivery systems, accurate forecasts of likely costs can help with general business planning in addition to prioritizing the allocation of scarce care management resources. Furthermore, for patients, knowing in advance their likely expenditures for the next year could potentially allow them to choose insurance plans with appropriate deductibles and premiums. Finally, it was found that gradient boosting increased prediction efficiency and accuracy than other machine learning used in this paper.
Random forest, Decision tree, Gradient boosting, Out of pocket expenditures.
According to World Health Organization, universal health coverage access to affordable and good-quality health services is essential to human welfare and economic and social development, (WHO, 2010). Furthermore, health financing can be achieved through a variety of channels, including government budgets, donor funding, health insurance, and direct payments.
In many countries direct payments, such as over-the-counter payments for medications and fees for doctors and services are the main forms of health financing, (WHO, 2010). However, health problems are causing not only suffering and death but also negatively affect financial sides. Furthermore, the increase of out of pocket medical expenditures continues to be one of the world's biggest problems. In 2010, the World Health Organization estimated that, every year, 100 million people are pushed into poverty and 150 million suffer financial catastrophe because of out-of-pocket expenditure on health services. Furthermore, one of the high priority in Sustainable Development Goals (SDGs) was to provide Universal health care services specifically for the populations of low-and middle-income countries (UHC, 2017).
In many low-and middle-income countries (LMICs), out-ofpocket health payments represent a significant portion of household expenditures. Consequently, the incidence of catastrophic out-of-pocket health payments, defined by the World Health Organization as exceeding 40% of household income, is linked to a violent cycle of impoverishment because households have to scale back spending on other necessities such as food and schooling, (WHO, 2016).
Furthermore, in most low and middle income countries, Outof- Pocket health expenditures at household level account for 20% to 60% of National Health Expenditure while in most developed economies, this amount accounts for only 15% to 25% of the same, (World Health Organization, 2010). However, in East African Countries out of pocket medical expenditures are very high in general: in Uganda, in 2000 was 37.68%, in 2015 was 40.5%, Kenya in 2000 was 46.83%, in 2015 was 33.37%, in Burundi in 2000 was 42.68%, in 2015 was 19.07%, Tanzania in 2000 was 37.69%, in 2015 was 26.15%and south Sudan in 2015 was 61.35% of overall health expenditures (World Health Development indicators, 2017).
The increase in out of pocket medical expenditures continue to be one of the world's biggest challenges; in Rwanda we observe a marked increase in out of pocket medical expenditures from 24.46% in 2000 to 26% in 2015, (World Health Development indicators, 2017). Therefore, various efforts have been made by the government of Rwanda to improve access to health services through community Based Health insurance. In 1999 the government of Rwanda established the Community Based Health Insurance and scaled it up national wide in 2005 in order to reduce the high out of pocked medical expenditures.
Health spending through out-of-pocket payment (OOP) is not always easy to cope with. Households may encounter financial hardship and poverty as a result. Moreover, over 150 million people face catastrophic health expenditure every year and 100 million fall into poverty worldwide after paying for health care [1]. Thus, benefiting from health care remains difficult or impossible for many households in the worldwide because of financial barriers. Therefore, universal coverage and access to health insurance, with an important degree of prepayment, is an important policy objective that could improve financial protection for many households [1].
In Rwanda, access to healthcare was identified as a primary objective in formulating public policies since good health is recognized as a necessary condition for enjoying economic and social opportunities. Moreover, the country has developed a healthcare setting open to all Rwandans that is accessible to everyone regardless of socioeconomic status. With reference to the Rwanda Economic Development and Poverty Reduction Strategy EDPRS, (2008), access to healthcare is one of the strategies for eradicating poverty. Furthermore, this strategy has an objective of promoting healthcare to the entire population, increasing geographical accessibility, increasing the availability and affordability of drugs and improving the quality of services. Increased accessibility to healthcare has several benefits particularly among poor segments of the population (World Bank, 2001). Moreover, the Millennium Development Goals (MDGs) also recognize health as an essential ingredient in social and economic progress for any country.
Rwanda has put in place policies to safeguard financial protection through Community Based Health Insurance Schemes (CBHIs) and other insurance providers, in Rwanda, but the average amount to pay for health services at household level or at individual level is not well known. Furthermore, some people are still suffering from an increase in out of pocket medical expenditures causing those delays in medical services and leading to permanent poverty, and some households are facing with the challenges of paying medical bills or may delay of getting healthcare because of lacking payments. One of Barriers to accessing health services is the high cost of health care services (World Bank, 2011).
In Rwanda, despite efforts to make healthcare more affordable, particularly through the widely successful community health mutual insurance scheme, Mutuelle de Santé, hospitals continue to lose millions of Francs in unsettled bills and some hospitals retain patients who cannot pay the medical bills [2].
One of the strategies adopted by the government of Rwanda was based on health care reforms significantly helped increase of health coverage; but there are still gaps in implementation and universal coverage has not yet been reached. One way of fighting against this problem is to predict such costs with high accuracy in order to plan for the future and reduce the increase in health care cost.
The purpose of this paper is to compare several machine learning techniques applied to an estimation of out of pocket health expenditure in Rwanda. Previous studies have used two-part models for estimating the out of pocket health expenditures in Rwanda. Furthermore, past work did not take into consideration nonlinear relationship and interaction between variables [3]. We will look at these issues, but in addition we will look at extreme values and consider the machine learning algorithm which provides the highest accuracy.
“In Rwanda, one of the main challenges facing households is chronic diseases such as cancer, diabetes, kidney failure, hepatitis, and heart attack among others, which health experts contend are costing people a lot of money and the vulnerable citizens are burdened by the medical bills they have to cover. Moreover, non-communicable diseases are expensive in terms of treatment, and they are costing the country and even the insurance sector a lot of money, said the Rwanda Minister of Health, Dr. Diane Gashumba, 2018”. It is in this regard that one might consider how to cover all medical expenses for patients with health insurance.
The predictive models for forecasting the patients ’ expenditures of future time periods based on previous time periods will be constructed. Moreover, monthly health expenditures was extended to yearly health and the data used were be based both households and individual levels. All the data were extracted from Integrated Living standard condition in Rwanda EICV5, (NISR, 2018).
Machine learning models, including tree-based models, Gradient Boosting algorithm and Random Forests, Gradient Boosting algorithm were performed to predict future health expenditures.
Figure 1 shows the conceptual frame work.
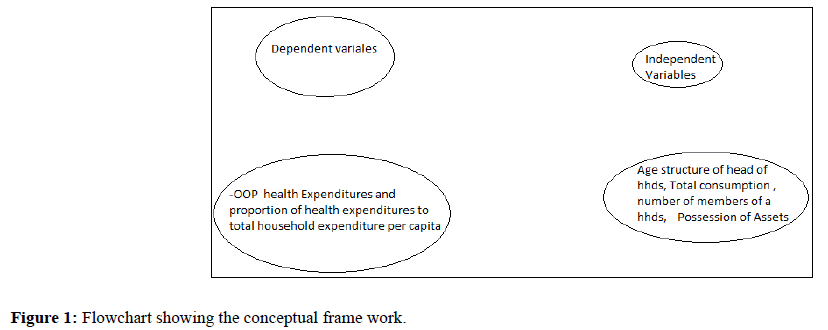
Figure 1. Flowchart showing the conceptual frame work.
Many studies have been conducted on predicting the out of pocket medical expenses using Machine Learning Techniques in the world, however, in Rwanda there was no study dealt with predicting the out of pocket medical expenditures using machine learning techniques.
The findings from Wang et al. [3], by estimating the out of pocket health expenditures in Rwanda they adopted the approach of a two-part model to estimate the correlates of outof- pocket expenditures for outpatient and inpatient care. A limitation of their findings is doubtful because of the presence of biasedness caused by sample selection with respect to unobservable characteristics and the presence of zero cost expenditures for health on some households. Moreover, they did not take into consideration of nonlinear relationship and interaction between variables. We address these issues in this paper and tackle the problem of extreme values will be tackled by using the machine learning Algorithms.
The findings from the research conducted by Patriche et al. [4], on supervised Learning Methods for Predicting Healthcare Costs on Systematic Literature Review and Empirical Evaluation in the USA, by using gradient boosting Artificial Neural Network (ANN) they found that gradient boosting had the best predictive performance overall and for low to medium cost individuals. For high cost individuals, Artificial Neural Network stated that predicting healthcare costs for individuals using accurate prediction models was important for various stakeholders beyond health insurers, and for various purposes. Moreover, for health insurers and increasingly healthcare delivery systems, accurate forecasts of likely costs can help with general business planning in addition to prioritizing the allocation of scarce care management resources. Furthermore, for patients, knowing in advance their likely expenditures for the next year could potentially allow them to choose insurance plans with appropriate deductibles and premiums.
Previously proposed cost prediction models often used rule based methods and multiple linear regression (MLR) models. The challenge with rule based methods is that they require a lot of domain knowledge, which was not easily available and was often expensive [5]. MLR models are powerful tools for capturing the relationships between the exploratory variables and the dependent variable, but, working with several independent variables often causes a multicollinearity problem, resulting from the presence of significant correlations among the predictors [4].
In addition, their performance was challenged by skewed healthcare data. Healthcare cost data typically feature a spike at zero, and a strongly skewed distribution with a heavy righthand tail [6]. Prediction models also face the challenge of extreme values. It is known that regression models are sensitive to extreme values and likely to be inefficient in small to medium sample sizes if the underlying distribution is not normal [7]. In the past, several advanced statistical methods have been proposed to accommodate the skewness observed in health care data, such as Generalized Linear Models (GLM), [8] mixture models based on mixtures of parametric models [9].
The development of accurate healthcare cost prediction models using machine learning methods has been more recent [9], utilize classification tree and Regression trees to provide predictions of healthcare costs. Moreover, Bertsimas et al. [10] investigates regression trees to predict whether an Household is going to incur higher or lower health care expenditure. The few studies conducted in Rwanda on Out of pocket health expenditures used a two part model which faced limitation as discussed above this paper employs techniques to improve the accuracy of estimates and prediction of costs of health services in Rwanda.
In this research application of all the four machine learning techniques for the case of Rwanda will be applied, to predict the out of pocket expenditures on utilization of Health care services in Rwanda. There are three machine learning algorithms to be used are regression tree, and random forest, gradient boosting.
Machine learning
Machine learning is a branch of artificial intelligence that employs a variety of statistical, probabilistic and optimization techniques that allows computers to “ learn ” from past examples and to detect hard-to-discern patterns from large, noisy or complex data sets [10].
Random forest
Random forest is an ensemble classifier that consists of many decision trees and outputs the class that is the mode of the class's output by individual trees. It is an ensemble learning algorithm that generates a set of decision trees, where each tree is built using a bootstrapped sample of the original training examples and each node in the tree is obtained from considering only a randomly selected subset of all available features. In this way, the diversity among trees is established, which is key in the random forest algorithm. In Rwanda, the government has done a lot for its population to access the health services easily. However, it is one of the African countries with the high rate of people with health insurance through Community health service 96% of the population and overall health insurance possession is around 74%. Despite all efforts and high rate of health coverage in general there exist some gaps caused by an increase of out of pocket medical expenditures which might lead to delays of accessing medical health care. However, one of the ways of handling this issue is to predict the out of pocket medical expenditures with accuracy [11-15].
Moreover, machine learning algorithm have not been sufficiently used previously to predict the future health care cost in Rwanda by considering zero health cost, thus the lack of the efficient method to be used to predict future health care cost of household in Rwanda is a big challenge for the patients and decision makers. It is in this regard that our paper aimed to predict the out of pocket medical expenditures in Rwanda using machine learning approaches and compares the results using four machine learning approaches such as Random Forest, Decision tree Models, Gradient Boosting, Regression tree models. The data to use for this analysis was collected from National Institute of Statistics (NISR) that is the Integrated Living Conditions Survey 2016-2018 (EICV5). However, this nationally representative survey gathered data from over 14580 households and representing 64314 individuals throughout the country [16-20]. Information was collected at the household and the individual level. Household level information such as the out-of-pocket health expenditures including: consultation; laboratory tests; hospitalization; Diabetes, blood pressure, and other illness and medication costs. Decision tree Train accuracy was: 65% and Test accuracy was 67%, Random Forest Train accuracy was 77% and Test accuracy was 68% and gradient Boosting was selected as the best model because the Train accuracy was 78% and Test accuracy was 85%, a variable total consumption played a significant role in the model up to 59.15%.
However, the findings proved that suggest that medical expenditures are significantly correlated with the total consumption and ages and shows that there is significant correlation in health care expenditures. Machine learning models can help to accurately forecast the expenditures. These results could advance the field toward precise preventive care to lower overall health care costs and deliver care more efficiently. Moreover, for health insurers and increasingly healthcare delivery systems, accurate forecasts of likely costs can help with general business planning in addition to prioritizing the allocation of scarce care management resources. Furthermore, for patients, knowing in advance their likely expenditures for the next year could potentially allow them to choose insurance plans with appropriate deductibles and premiums. Finally, it was found that gradient boosting increased prediction efficiency and accuracy than other machine learning used in this paper.
Figure 2 indicates that the households located in Kigali city spent much money on health services than other provinces. It shows that Northern Province spent less much money in health services in Rwanda.
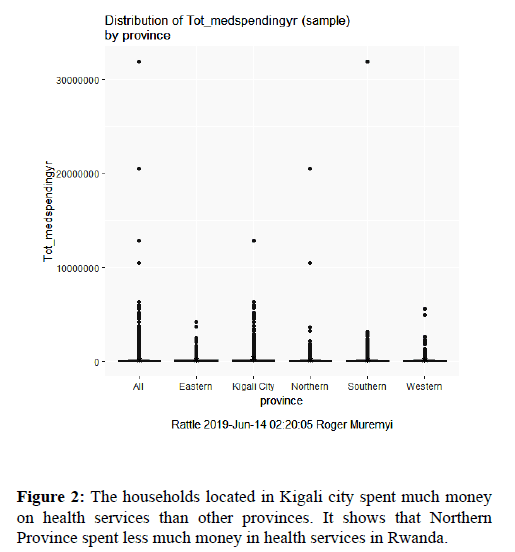
Figure 2. The households located in Kigali city spent much money on health services than other provinces. It shows that Northern Province spent less much money in health services in Rwanda.
Figure 3 indicates the yearly health expenditures and high rate expenses were seen in consultation.
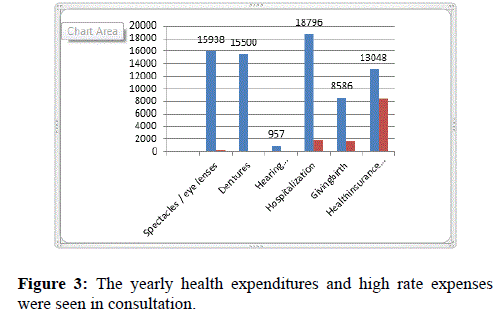
Figure 3. The yearly health expenditures and high rate expenses were seen in consultation.
Figure 4 indicates the amount spent by household at the end of the month and it shows that much money was spent in Medical exam and contraceptives.
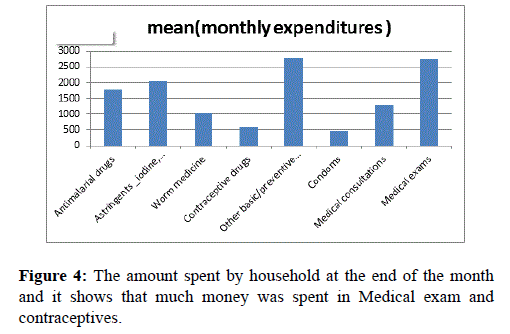
Figure 4. The amount spent by household at the end of the month and it shows that much money was spent in Medical exam and contraceptives.
This pie chart (Figure 5) indicates that a big number of respondent were in Ubudehe Category 3 and it was found at individual level and a big number of people who don’t have the Ubudehe Category.
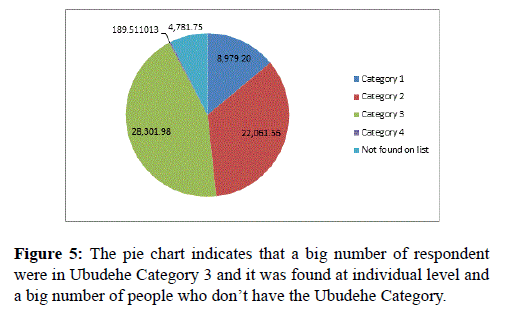
Figure 5. The pie chart indicates that a big number of respondent were in Ubudehe Category 3 and it was found at individual level and a big number of people who don’t have the Ubudehe Category.
This graph in Figure 6 is indicating a big number of respondents has mutual health insurance and non-negligible number of respondent who don’t have health insurance.
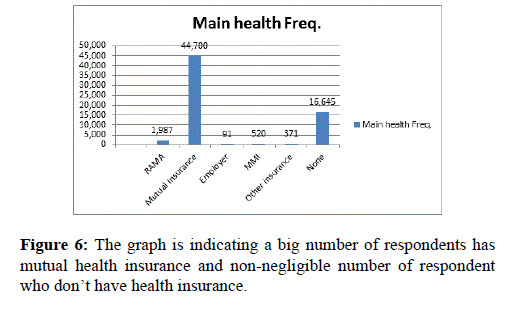
Figure 6. The graph is indicating a big number of respondents has mutual health insurance and non-negligible number of respondent who don’t have health insurance.
In Table 1 there were 32 respondents who were in category one who has RAM, which indicating errors in classifying ubudehe categories.
| UBUDEHE Category | RAMA | Mutual in | Employer | MMI | Other | ins | None |
|---|---|---|---|---|---|---|---|
| Category 1 | 32 | 7765 | 3 | 12 | 12 | 1176 | 9000 |
| Category 2 | 199 | 14436 | 18 | 65 | 60 | 7123 | 21901 |
| Category 3 | 1474 | 20343 | 51 | 346 | 197 | 6272 | 28683 |
| Category 4 | 23 | 89 | 0 | 13 | 11 | 29 | 165 |
| Not found on list | 259 | 2067 | 19 | 84 | 91 | 2045 | 4565 |
Table 1: There were 32 respondents who were in category one who has RAM, which indicating errors in classifying ubudehe categories.
Figure 7 shows the four plots in the set of diagnostic plots are: (1) the Model Selection plot; (2) the Cumulative Distribution plot; (3) Residuals vs. Fitted plot; and (4) the Normal Q-Q plot.
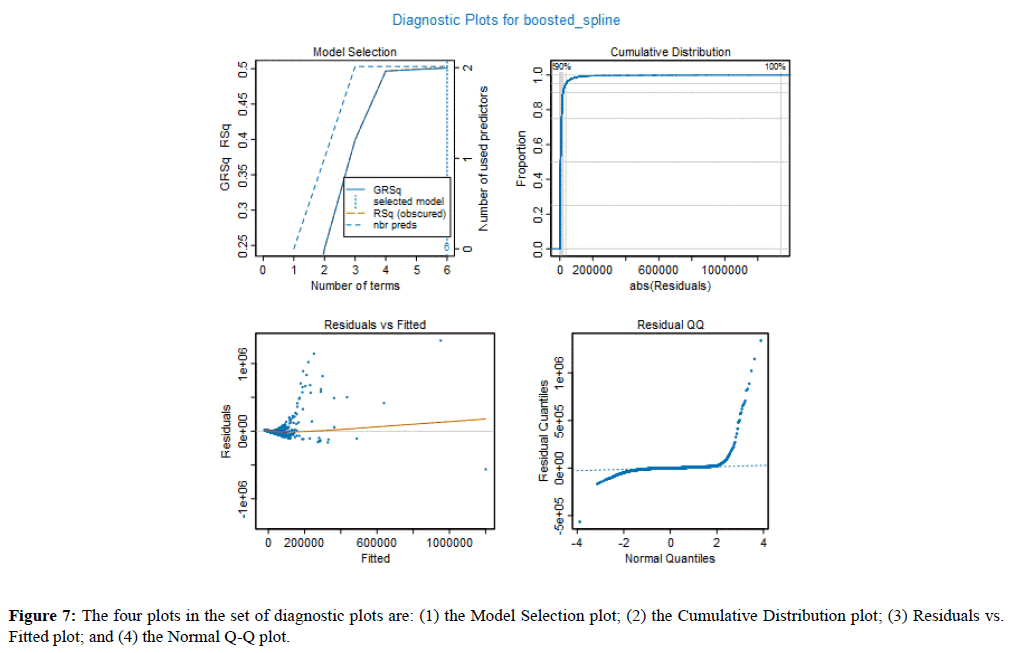
Figure 7. The four plots in the set of diagnostic plots are: (1) the Model Selection plot; (2) the Cumulative Distribution plot; (3) Residuals vs. Fitted plot; and (4) the Normal Q-Q plot.
The Model Selection plot gives the RSq (R-Squared) and GRsq (penalized R-Squared of the model), while the dashed line gives the number of terms in the model. However, the model with the highest GRSq value is selected, and the vertical dotted line indicates the number of model terms included in this best model. Train accuracy 83% and the Test accuracy 85%.
The Cumulative Distribution plot shows the cumulative distribution of the absolute values of the model residuals, which ideally starts at zero and quickly rises to one.
The Residuals vs. Fitted value plot shows the residual for each value of the predicted response. By comparing the scales of the two axes, one can quickly gain a sense of the size of the residuals relative to the predictive values. The thin line in the plot indicates how the average magnitude of the residuals changes with the size of the predictive value. Ideally, this would be essentially a horizontal line centered at zero of the Residuals (vertical) axis of the plot.
The Normal Q-Q plot compares the distribution of the residual to a normal distribution. Deviations for normality are only critical when the target is continuous, and the Gaussian GLM family is selected. Its value for other models is the ability to see potential outliers in the data.
The variable Importance Plot (Figure 8) provides information about the relative importance of each predictor field. The measures are normalized to sum to 100, and the value for each field gives the relative percentage importance of that field to the overall model.
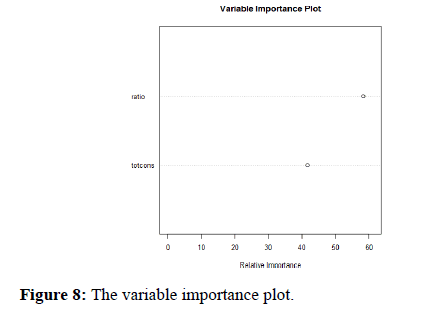
Figure 8. The variable importance plot.
Random forest model
The percentage of variance explained: 88.46
The plot of Figure 9 helps to describe how many trees in our model. However, on y–axis we have the errors of the model and on x-axis we have the number of trees used in model construction. As you can see from 0-50 trees the errors remain quite high but drops and flattens out at around 100 trees and tree is an additional drop for both classes at around 500 trees, therefore it could be interesting to add more additional trees to this model if the error will further decrease there will be of course become a point where each tree only adds further time and computation power but does not improve overall model performance.
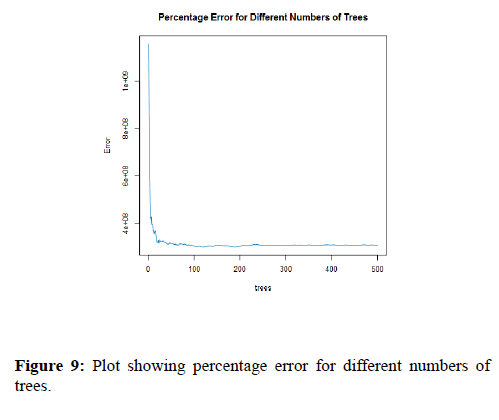
Figure 9. Plot showing percentage error for different numbers of trees.
Figure 10 shows how importance each variable is when classifying the data. The predictor variables on the y-axis with the mean decrease Gini on the x-axis, the mean decrease Gini is measuring how each variable contribute to the purity on each node in a tree. As with the number of trees with the forest reducing the number of variables within the model can decrease computation time and power without deceasing the model accuracy. However, it is important not to have too few predictive variables as the model might not be able to separate the classes correctly.
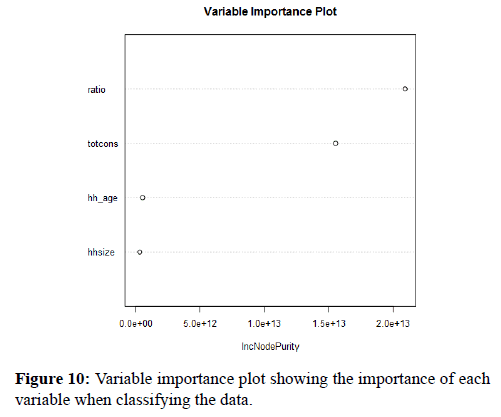
Figure 10. Variable importance plot showing the importance of each variable when classifying the data.
Decision tree model
Table 2 is the Pruning Table showing the data.
| Level | CP | Num splits | Rel error | X error | X std dev |
|---|---|---|---|---|---|
| 1 | 0.206087 | 0 | 1 | 1.00007 | 0.172502 |
| 2 | 0.085599 | 2 | 0.58783 | 0.74315 | 0.113045 |
| 3 | 0.053906 | 4 | 0.41663 | 0.56254 | 0.099113 |
| 4 | 0.034171 | 5 | 0.36272 | 0.49965 | 0.093941 |
| 5 | 0.027521 | 6 | 0.32855 | 0.44569 | 0.078523 |
| 6 | 0.020693 | 7 | 0.30103 | 0.40001 | 0.077125 |
| 7 | 0.016595 | 8 | 0.28034 | 0.36354 | 0.07497 |
| 8 | 0.014112 | 10 | 0.24715 | 0.32244 | 0.072135 |
| 9 | 0.013021 | 11 | 0.23304 | 0.31264 | 0.071698 |
| 10 | 0.01276 | 12 | 0.22001 | 0.3129 | 0.071703 |
| 11 | 0.008437 | 13 | 0.20725 | 0.31121 | 0.080181 |
| 12 | 0.008038 | 14 | 0.19882 | 0.30285 | 0.080134 |
| 13 | 0.007222 | 15 | 0.19078 | 0.29685 | 0.080119 |
| 14 | 0.006371 | 16 | 0.18356 | 0.28761 | 0.079944 |
| 15 | 0.005883 | 17 | 0.17719 | 0.2835 | 0.07992 |
| 16 | 0.005319 | 18 | 0.1713 | 0.28014 | 0.079916 |
| 17 | 0.003797 | 19 | 0.16599 | 0.27146 | 0.079904 |
| 18 | 0.00356 | 20 | 0.16219 | 0.25457 | 0.078975 |
| 19 | 0.003411 | 21 | 0.15863 | 0.25324 | 0.07897 |
| 20 | 0.003178 | 22 | 0.15522 | 0.25156 | 0.078939 |
| 21 | 0.00265 | 23 | 0.15204 | 0.24022 | 0.078779 |
| 22 | 0.002557 | 24 | 0.14939 | 0.2371 | 0.078777 |
| 23 | 0.002167 | 25 | 0.14683 | 0.23421 | 0.078769 |
Table 2: is the Pruning Table showing the data.
The Model Summary lists the variables that were actually used to construct the model. We can see that for this tree, only two of the variables provided were used.
Root node error is the percent of correctly sorted records at the first (root) splitting node. This value can be used to calculate two measures of predictive performance in combination with Rel Error and X Error, both of which are included in the Pruning Table. Root Node Error x and Rel Error is the resubstituting error rate (the error rate computed on the training sample). Root Node Error x X Error is the cross-validated error rate, which is a more objective measure of predictive accuracy. n is the number of records used to construct the tree. Absolute error is the amount of physical error in a measurement, period. And Relative error gives an indication of how good a measurement is relative to the size of the thing being measure
For the Tree Plot of a regression tree, the terminal nodes depict the predicted response at that node. These values are calculated as the average response of health expenditures in Rwanda. However, the Pruning Plot depicts the crossvalidated error summary. The Complexity Parameter (cp) values are plotted against the cross-validation error calculated by the rpart algorithm (Figure 11).
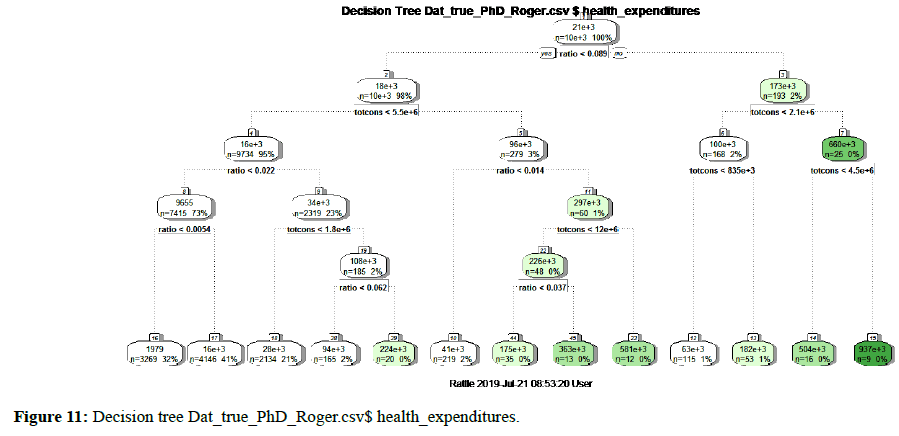
Figure 11. Decision tree Dat_true_PhD_Roger.csv$ health_expenditures.
Train AUC: 0.7774378265257159, which is 77%
Test AUC: 0.6827215484240277, which is 68%
The blue dashed line in Figure 12 represents the highest cross-validated error minus the minimum cross-validated error, plus the standard deviation of the error at that tree. A reasonable choice of cp (Complexity parameter) for pruning is often the leftmost value where the mean is less than the horizontal line. In this case, we see that the optimal size of the tree is 3 terminal node. The Pruning plot depicts information about pruning from the rpart algorithm. Rel error (relative error) is 1– R2 root mean square error. Moreover, this is the error for predictions of the data that were used to estimate the model. The x-error is the cross-validation error (generated by the rpart built-in cross validation). Each level in the Pruning table is the depth of the tree where each of the corresponding values was calculated and can be used to help to make decision on where to prune the tree.
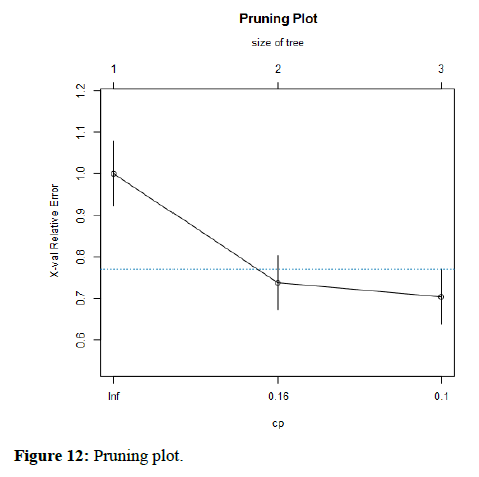
Figure 12. Pruning plot.
Model information from cross-validation and Performance Diagnostic Plots with 95% Confidence Interval was shown in Figure 13.
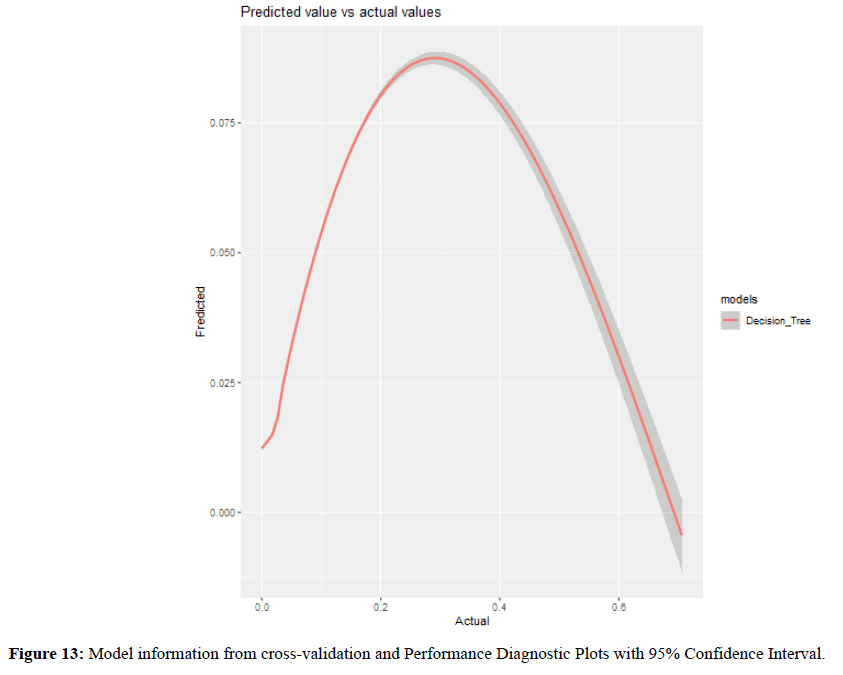
Figure 13. Model information from cross-validation and Performance Diagnostic Plots with 95% Confidence Interval.
Importance of the variables in the model was given in Table 3.
| Variables | Importance | impact |
|---|---|---|
| Hh_age | 0.024 | 0.024032 |
| Hhsize | 0.0074 | 0.007354 |
| Ratio | 0.3771 | 0.377091 |
| totcons | 0.5915 | 0.591523 |
Table 3: A variable total consumption played a significant role in the model up to 59.15%.
In Rwanda, the government has done a lot for its population to access the health services easily. However, it is one of the African countries with the high rate of people with health insurance through Community health service 96% of the population and overall health insurance possession is around 74%. Despite all efforts and high rate of health coverage in general there exist some gaps caused by an increase of out of pocket medical expenditures which might lead to delays of accessing medical health care. However, one of the ways of handling this issue is to predict the out of pocket medical expenditures with accuracy.
Moreover, machine learning algorithm have not been sufficiently used previously to predict the future health care cost in Rwanda by considering zero health cost, thus the lack of the efficient method to be used to predict future health care cost of household in Rwanda is a big challenge for the patients and decision makers. It is in this regard that our paper aimed to predict the out of pocket medical expenditures in Rwanda using machine learning approaches and compares the results using four machine learning approaches such as Random Forest, Decision tree Models, Gradient Boosting, Regression tree models. The data to use for this analysis was collected from National Institute of Statistics (NISR) that is the Integrated Living Conditions Survey 2016-2018 (EICV5). However, this nationally representative survey gathered data from over 14580 households and representing 64314 individuals throughout the country. Information was collected at the household and the individual level. Household level information such as the out-of-pocket health expenditures including: consultation; laboratory tests; hospitalization; Diabetes, blood pressure, and other illness and medication costs.
However, the findings proved that suggest that medical expenditures are significantly correlated with the ages and shows that there is significant correlation in health care expenditures. Machine learning models can help to accurately forecast the expenditures. These results could advance the field toward precise preventive care to lower overall health care costs and deliver care more efficiently. Moreover, for health insurers and increasingly healthcare delivery systems, accurate forecasts of likely costs can help with general business planning in addition to prioritizing the allocation of scarce care management resources. Furthermore, for patients, knowing in advance their likely expenditures for the next year could potentially allow them to choose insurance plans with appropriate deductibles and premiums. Finally, it was found that gradient boosting increased prediction efficiency and accuracy than other machine learning used in this paper. R squared was 0.853 and adjusted r squared 0.853.
Received: 09-Aug-2019
Copyright: ©2019 Muremyi R et al. This is an open access paper distributed under the Creative Commons Attribution. Journal of Health and Medical Research published by Lexis Publisher.