Research Article - (2022) Volume 11, Issue 3
Background and aim: Air pollution has emerged as a serious global issues. Among anthropogenic sources, only mobile sources, i.e., vehicles contribute 70% of total air pollution as it emit higher amount of air pollutants into the ambient atmosphere, which create negative impact on air quality. To reduce such impact, environmentalists and policy makers have emphasized on the necessary of bio-monitoring of air pollution by using trees. Malda is famous for mango orchards which are abundant along NH-34 and SH-10. This district is home of 200 folk mango varieties of which Fazli, Aswina, Laxmanbhog, Langra, and Himsagar are predominant, hence these varieties have been selected for bio-monitoring.
Methods: The present study was conducted alongside national and state highways, i.e., NH-34 and SH-10 within Malda district from January- December, 2016. Then, 24 hours monitoring of NO2, SO2, and PM10 was carried out. All the leaves samples were collected in triplicate for estimation of the Total chlorophyll (Tchl), Ascorbic Acid (ASC), Relative Water (RWC) content, and Air Pollution Tolerance Index (APTI).
Results: The monthly average concentration of NO2 was highest (22.04 μg.m-3) during December and lowest (19.04 μg.m-3) during June 2016. SO2 concentration was maximum (4.38 μg.m-3) during October and minimum (2.00 μg.m-3) during June and August. 24 h monthly average concentration of PM10 was highest during January (124.43 μg.m-3) and surpassed the NAAQS (100 μg.m-3). The average ASC, Tchl content, and RWC was found to be maximum in Fazli. Leaf extract pH ranged from 4.93 ± 0.70 in Langra to 6.46 ± 0.33 in Himsagar. The APTI value of Fazli was found maximum (22.12 ± 0.26) and recognized as tolerant species.
Conclusion: As per the APTI value, Fazli is found to be a tolerant species, and Aswina, Laxmanbhog, Langar, and Himsagar are sensitive species.
APTI • NH-34 • SH-10 • Vehicular air pollution • Mango varieties
Air pollution is gradually becoming an alarming problem in developed and developing countries due to the rapid and unsustainable industrialization and urbanization [1]. With growing economy and improved lifestyle, the numbers of vehicles are also increasing at much faster pace as a result it contributed approximately 70% of total urban air pollution [2]. Therefore, it regards as a principle contributor to urban air pollution worldwide [3,4]. From the prior research studies, it was noted that the key pollutants of vehicular emission include Sulphur Oxides (SOX), Nitrogen Oxides (NOX), Carbon Oxides (CO, CO2), Hydrocarbons (HCs), Polycyclic Aromatic Hydrocarbons (PAHs), and Particulate matters (PM2.5, PM10, PM1) [3,4] which deteriorates the ambient air quality, but also poses severe impact on human beings and animals [4].
Moreover, air pollutants can adversely affect the plant growth by altering the biochemical composition, rate of photosynthesis, seed germination, number of flower on florescence, length of pedicle, and stomata [5-8].
Although numbers of advanced technologies are used for mitigation of air pollution but there are some significant drawbacks such as expensive materials, sophisticated maintenance, etc. Whereas, the bio-monitoring of air pollution by using roadside trees is a natural and cost effective way out due to the presence of their enormous leaf that impingement, accumulate and detoxify the pollutants and thus make the ambient air clean and healthy [7,9]. Additionally, they can also adapting in the changed environment by virtue of biochemical adjustments particularly in ASC, Tchl content, leaf extract pH, and RWC. These adjustments in biochemical characteristics can be combined to determine the plant responses through the APTI [10-13].
Since time immemorial, the mango (Mangifera indica L.) is being cultivated with utmost care and great reverences besides NH-34 and SH-10 within Malda district which is the home of about 200 folk varieties. Among them, there are seven prominent commercial varieties (Fazli, Aswina, Laxmanbhog, Himsagar, Langra, Gopalbhog and Amrapalli); but, three, i.e., Laxmanbhog (G.I. No. 111), Himsagar (G.I. No. 112) and Fazli (G.I. 113) are also Geographical Indication (G.I.) varieties. The district produced about 225000 MT in 2011 with an average productivity of 8.04 MT/ha. The above mentioned G.I. varieties alone contribute about 75% of total production and seven commercial verities contribute nearly 90% of the district’s total production. In terms of area, these G.I. varieties cover about 60% of total area under the mango crop and all commercial varieties cover about 75% of area under this king of fruits in 2011 [14]. In this present study, based on the important share to the gross mango crop production, five mango (Mangifera indica L.) varieties namely Fazli, Aswina, Laxmanbhog, Himsagar, and Langra have been selected for biomonitoring of air pollution through APTI alongside NH-34, and SH-10 within Malda district, West Bengal, India.
Study areas
The present study has executed alongside one national and state highways, i.e., NH-34 and SH-10 within Malda district (25˚ 32’ 8” N-24˚ 40’ 20” N and 88˚ 28’ 10” E-87˚ 45’ 50” E) from January- December, 2016 (Figure 1). Within this district, the total length of NH-34 is 71 km and approximately 9,350 vehicles run through NH-34 every day [15]. The SH-10 starts from Malda town and ends at Hili. It connects with NH-81 at Samsi and runs along NH- 81 then joins with NH-34 at Gazole Kadhubarimore [16]. The total length of this highway is 173 km of which 78 km falls within this district. These highways play important contribution to the economic development and bring major social benefits [16]. This district falls within the tropics and exhibits a typical climate setup. Therefore, this district is also famous for its mango orchards [17], which are abundant along NH-34 (at English bazar, Kaliachak-1, Kaliachak-3, and Gazole) and SH-10 (at Amrity, Manikchak, Ratua-I, Ratua-II, and Samsi). Hence, a total of 19 sampling sites and 09 monitoring sites were selected at suitable locations based on mango orchards abundance besides highways. Among the sampling sites, 12 sites (PS-1 to PS-12) are in NH-34 and 07 sites (PS-13 to PS-19) in SH-10; and in the monitoring sites, 06 sites (MS-1 to MS-6) in NH-34 and 03 sites (MS-7 and MS-9) in SH-10.
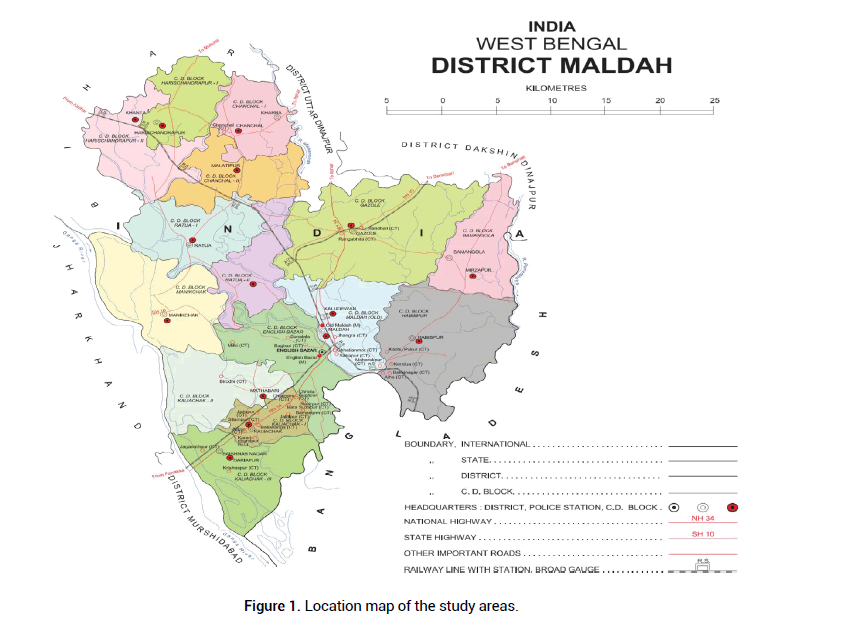
Figure 1: Location map of the study areas.
Assessment of ambient air quality
Ambient air quality was investigated by 24 hours basis monitoring of two gaseous pollutants, i.e., NO2 and SO2, and one particulate pollutant, i.e., PM10 at the monitoring sites of study area using gaseous pollutant samplers (Model: APM 433, Envirotech Instr, Pvt. Ltd, India), and a fine particulate sampler (Model: GTI-375, Greintech Insr, Pvt. Ltd, India). The concentration of NO2 and SO2 were determined following the methods as described by Jacob and Hochheiser [18] and West and Geake [19] with minor modification. The concentration of PM10 was measured by dividing weight of PM10 dust (the subtraction of initial weight from final weight of PM10 filter paper) with total air sampling volume.
Sample collection and plant response analyses
Fully mature leaves of five predominant mango varieties, i.e., Fazli, Aswina, Laxmanbhog, Langra, and Himsagar (Figure 2) were collected in triplicate (3 plants of single species) from all the sampling sites at a height of 1.5-3.0 m above ground level alongside NH-34 and SH-10 in early morning (8 AM-10 AM). Subsequently, the collected leaves were placed in zipper bags and then kept in the ice gel containing box and brought to the laboratory for further analyses. The Tchl content (mg.g-1) was estimated by the standard method of Maclachlan and Zalik [20]. The ASC (mg.g-1) of leaves was calculated by using DCPIP dye reduction method of Keller and Schwager [21]. Leaf extract pH was measured with a digital pH meter (Model: pH tutor, EuTech). RWC (%) was determined with the method as described by Singh [22]. Response of these varieties towards air pollution was assessed by the following equation of APTI, adopted by Singh and Rao [10],
APTI=[{A(T+P)}+R]/10
Where, A=ascorbic acid content, T=total chlorophyll content, P=pH of leaf extract and R=Relative water content (%) of leaves.
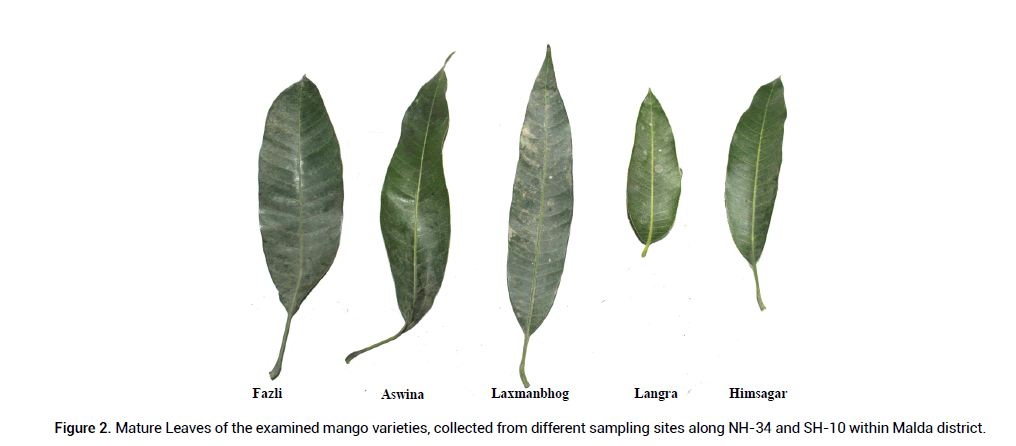
Figure 2: Mature Leaves of the examined mango varieties, collected from different sampling sites along NH-34 and SH-10 within Malda district.
Statistical analyses
To analyse the responses of mango varieties, the Shapiro-Wilk test was carried out to measure the normal distribution of all data sets. If the ‘p value’ was ≥ 0.05 at the five percent level of significance, data sets were considered to be normal. For some of the data sets that failed the normality test, Kurtosis and Skewness were applied. If the values of Kurtosis and skewness were 3 and 0 respectively, it was assumed to be normal. Thereafter, ANOVA was conducted to determine the significance of the quantitative change of the studied parameters due to air pollution. Then, Duncan’s test has performed as post hoc on parameters subjected to ANOVA (only if the ANOVA was significant). All the statistical tests were carried out by SPSS software (SPSS Inc., ver. 21).
The monthly average concentration of NO2 was recorded to be highest, i.e., 22.04 μg.m-3 during December, and lowest, i.e., 19.04 μg.m-3 during June 2016. However, SO2 concentration was maximum (4.38 μg.m-3) during October and minimum (2.00 μg.m-3) during June and August. Both gaseous pollutants (NO2 and SO2) did not exceed the National Ambient Air Quality Standards (NAAQS) of 80 μg.m-1 during the study period (Figure 3). On the other hand, 24 h monthly average concentration of PM10 was highest during January (124.43 μg.m-3) followed by March (116.53 μg.m-3), February (115.04 μg.m-3), December (106.20 μg.m-3), and April (103.76 μg.m-3) and surpassed the NAAQS (100 μg.m-3); while minimum (45.90 μg.m-3) during September of 2016 (Figure 3). The concentration of all pollutants was found maximum in the winter season (October-January). This might be caused due to the atmospheric inversion, i.e., cool air above and warm air below gets inverted. This condition tends to trap a dense layer of cold air under a layer of warm air. This stagnant condition of the atmosphere traps the pollutants near the surface of the earth [23]. Furthermore, the higher concentration of PM10 could be attributed owing to the running of diesel and petrol vehicles on highways which generate a range of particulate matter through the dust produced from brakes, clutch plates, tires and indirectly through the resuspension of particulates on road surfaces through vehicles-generate turbulence [24, 25]. Oppositely, the lowest concentration of pollutants was observed during the monsoon season (June-September) probably owing to the washout of pollutants by rain [26].
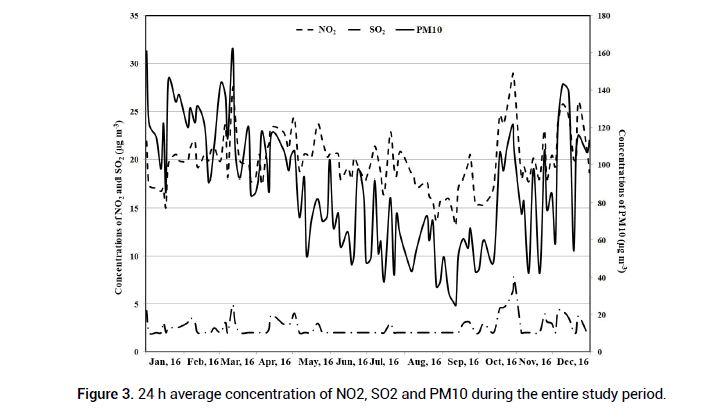
Figure 3: 24 h average concentration of NO2, SO2 and PM10 during the entire study period.
The average ASC was found to be highest in Fazli (4.38 ± 0.21 mg.g-1) followed by Langra (3.96 ± 0.29 mg.g-1), Laxmanbhog (3.92 ± 0.29 mg.g- 1), and Aswina (3.89 ± 0.19 mg.g-1) whereas, lowest in Himsagar (3.78 ± 0.16 mg.g-1). One-way ANOVA result demonstrated non-significant variation in the ASC of all mango varieties (Figure 4). Generally, ASC is found in the growing parts of the plant, acts as an antioxidant, and also gives resistance toward stress conditions [12,13]. An increased level of ascorbic acid decreases reactive oxygen species (ROS) concentration in leaves at a higher pollution load and enhances the tolerance capacity of plants [13]. The Tchl content was maximum in Fazli (1.96 ± 0.10 mg.g-1) and minimum in Aswina (0.34 ± 0.08 mg.g-1). ANOVA result showed a significant variation in the Tchl content of Fazli and Aswina (Figure 4). The Tchl content has been reduced at polluted site. This might be caused owing to the destruction of chlorophyll and inhibition of RuBp carboxylase in presence of PM10, NO2, and SO2 [27]. The depletion of chlorophyll has been used as an indicator of air pollution [12]. Higher chlorophyll content leads to increase tolerance capacity of plants toward air pollutants [12,27]. The average leaf extract pH ranged from 4.93 ±0.70 in Langra to 6.46 ± 0.33 in Himsagar at all the sampling sites. According to the ANOVA result, there was a non-significant variation in leaf extract pH of all mango varieties (Figure 4). Here, leaf extract pH has been reduced in all varieties. It might contribute due to the presence of NO2 and SO2 at the sampling sites. Govindaraju, et al. [28] depicted the tolerance capacity of plants increases at high pH levels to air pollutants. RWC was found highest in Fazli (188.19 ± 3.59%) followed by Himsagar (80.48 ± 2.86%), Langra (80.40 ± 2.70%), Aswina (78.97± 2.41%), and Laxmanbhog (78.25 ± 6.09%). Oneway- ANOVA result demonstrated a significant variation in RWC of all varieties (Figure 4). It has been reported that RWC is associated with protoplasmic permeability. Therefore, plants with higher RWC are feasibly more tolerant towards stress conditions such as air pollution, drought, and so on, etc. [11]. The APTI value of Fazli was found maximum (22.12 ± 0.26) followed by Himsagar (10.90 ± 0.43), Langra (10.36 ± 0.49), Laxmanbhog (10.24 ± 0.84), and Aswina (10.00 ± 0.24). As per the ANOVA result, the APTI value of Fazli showed significant variation as compared to the other varieties’ APTI value (Figure 5). Plant species with higher APTI values are more tolerant to air pollution [9,11,12]. Plants having the APTI value less than or equal to 12 are known as sensitive species; though plants having APTI values range from 13-16, 17-20, and above 20 indicate intermediate tolerance, moderately tolerant, and tolerant to air pollutants [11]. Therefore, Fazli was recognized as tolerant species and other varieties were sensitive species to air pollution.
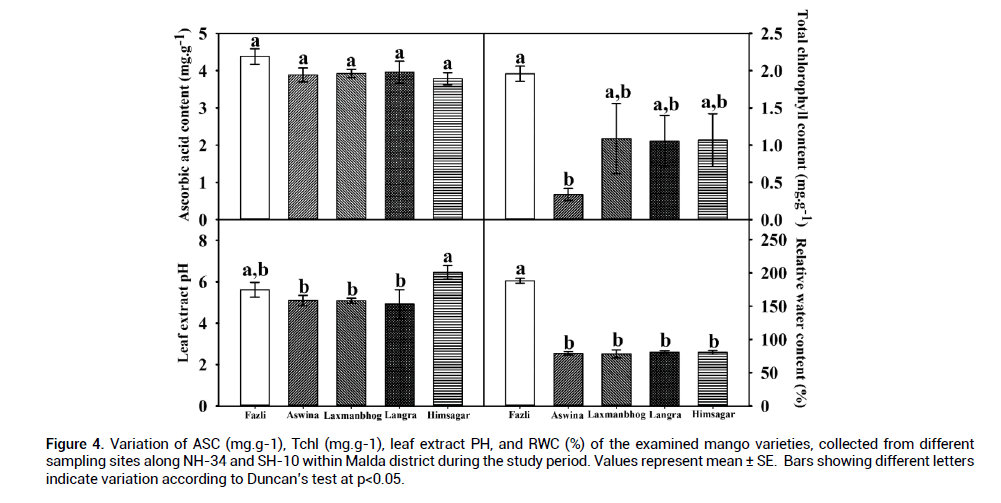
Figure 4: Variation of ASC (mg.g-1), Tchl (mg.g-1), leaf extract PH, and RWC (%) of the examined mango varieties, collected from different sampling sites along NH-34 and SH-10 within Malda district during the study period. Values represent mean ± SE. Bars showing different letters indicate variation according to Duncan’s test at p<0.05.
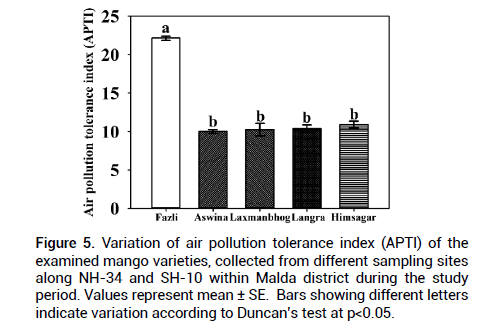
Figure 5: Variation of air pollution tolerance index (APTI) of the examined mango varieties, collected from different sampling sites along NH-34 and SH-10 within Malda district during the study period. Values represent mean ± SE. Bars showing different letters indicate variation according to Duncan’s test at p<0.05.
This study designates air pollution has a wide impact on mango varieties that grow alongside NH-34 and SH-10 in the Malda district. Here, Fazli is found to be a tolerant species, and Aswina, Laxmanbhog, Langar, and Himsagar are sensitive species. Therefore, Fazli has the highest capacity to combat air pollution and also acts as a pollution sink and reduces air pollution to make the ambient atmosphere clean and healthy. But, these sensitive mango varieties have the capacity to monitor air pollution. Hence, these mango varieties can be used for in-situ bio-monitoring beside NH-34 and SH-10 within Malda district and its similar type of climate for restoring the ecosystem and also the economic purpose.
Authors thankfully acknowledge the Department of Science & Technology and Biotechnology (DST&BT), Government of West Bengal, for providing the financial support in the form of a research project (Memo No.: 207(Sanc.)- ST/P/S&T/5G-14/2018, dated: 20th February, 2019) to AS.
[Cross ref] [Google scholar] [PubMed]
[Cross ref] [Google scholar] [PubMed]
Citation: Das S, et al. Utilization of mango plants (Mangifera indica L.) as in situ bio-monitoring tool against vehicular air pollution along National and State Highways: A case study from Malda district, West Bengal, India. J Biol Today's World, 2022, 11(3), 001-004
Received: 28-Mar-2022, Manuscript No. JBTW-22-58729; Editor assigned: 31-Mar-2022, Pre QC No. JBTW-22-58729 (PQ); Reviewed: 14-Apr-2022, QC No. JBTW-22-58729 ; Revised: 18-Apr-2022, Manuscript No. JBTW-22-58729 (R); Published: 28-Apr-2022, DOI: 10.35248/2322-3308-11.3.004
Copyright: © 2022 Das S, et al. This is an open-access article distributed under the terms of the Creative Commons Attribution License, which permits unrestricted use, distribution, and reproduction in any medium, provided the original author and source are credited.