Research Article - (2019) Volume 8, Issue 3
Breast cancer is one of most common malignancy among women. About 74% of breast cancers have classified as estrogen receptor positive (ER+) breast cancer. As obesity play a role in altering estradiol hormone level, it is important to focus on obesity as one of ER+ breast cancer risk factor. The aim of this research was; to investigate the distribution of ESR1 gene alleles, comparing estradiol level between breast cancer patients and control group (obese and normal), and to correlate this single nucleotide polymorphisms (SNP) to obesity in ER+ breast cancer patient. The study included 119 participants (59 controls, 60 ER+ breast cancer patients). Two blood samples were collected from each participant; one were for studying the distribution of polymorphism in intron 3 in ESR1 (rs2347867 G>A+27944) using Restriction Fragment Length Polymorphism (RFLP) technique. The second sample was to measure E2 level using Electro-chem-iluminescence technique. The results indicate an association between polymorphism in intron 3 in ESR1 and breast cancer risk, it is also confirm the positive relationship between breast cancer diagnosis in postmenopausal women and high estradiol level. This study could not associate the alternation of E2 level to obesity or to polymorphism in intron 3 of ESR1. The suggested association between polymorphism rs2347867 and breast cancer risk needs to be confirm in larger samples. In addition, we recommend educating population about health hazard of obesity and the importance of maintaining an ideal weight for better health.
<ESR1, Obesity, Breast cancer, RFLP, Estradiol.
The prevalence of cancer makes it one of the most important diseases worldwide, which; in 2012, about 14.9 million new cases were reported. The second most common type of cancer is breast cancer, which account for 25% of all cancers and every year about 1.7 million of new breast cancer cases are reported [1]. About 74% of breast cancers express the estrogen receptor (ER+) and/or the progesterone receptor (PR+) but not human epidermal growth factor receptor 2 (HER2) [2]. According to Saudi Cancer Registry statistic of the year, 2013; 15,653 cases of cancer were reported, and most of these cases found in females (53%). Moreover, among this percentage 29% of the female affected cancer incidents are breast cancer, with highest incident in Eastern region, follow by Riyadh then Makah region [3].
Estrogen and its receptor regulate expression of genes that associated with the development of reproductive organ, bone modeling, cardiovascular system functioning, metabolism, and behavior in females and males as well as its play a role in development and progression of breast cancer [4]. Estrogen receptor alpha (ER-α) is the first form of estrogen receptor that locates on nuclear, with form of homodimer or heterodimer with Estrogen receptor beta (ER-β).This protein consists of 334 amino acids and encoded by ESR1 gene, that locates at band 25.1 in long arm of chromosome 6 (6q25.1). This gene is about 412779bp and comprises 18 exons [5]. Although ER-α & ER-β share similar sequence and structure, they have different role in breast cancer. ER-α found to have role in growth, proliferation and survival of cancer cell in response to estrogen, while ER-β oppose this role by increasing the expression of anti-proliferative genes and/or decreasing the expression of proliferative and anti- apoptotic genes in response to estrogen. ER-α/ER- β ratio is higher in breast cancer than in normal tissue [6]. Genetic variants in ESR1 gene may alter the ERα and its downstream signaling which in turn increase breast cancer susceptibility and tumor growth [7].
Obesity is one of the risk factors that influences ER+ breast cancer in some way, but this relation differs according to menopausal status. In post-menopausal woman, it is found to be associated with development of breast cancer, and it is found to have negative impacts on breast cancer prognosis for both pre-menopausal and post-menopausal [8].
In premenopausal woman estradiol level differ according to different cycling phase; in follicular phase is about 64 to146 pg/mL; in mid-cycle: 47 to169 pg/ml, and in luteal phase: <15 to 72 pg/mL. While, in postmenopausal woman estrogen is produce in other sites such as mesenchymal cells of adipose tissue, osteoblasts and chondrocytes of bone and numerous sites in brain tissue, by converting androgen to estrogen using enzyme aromatase. Therefore, the estradiol level in postmenopausal those are not on hormone therapy is <15 pg/mL [9-11].
As estrogen play a role in breast cancer progression, researchers are focusing on genetic variation that occur in estrogen receptor gene; few studies found a relation between susceptibility to breast cancer progression and SNPs in ESR1 gene. Lipphardt et al. found two SNPs in ESR1 gene; ESR1 intron SNP +2464 C/T (rs3020314) in intron 4 and ESR1 intron SNP-4576 A/C (rs1514348) in intron 2, that correlated to risk to development breast cancer in the European population [12]. The rs2046210 is a SNP locate upstream ESR1 and found to be highly related to breast cancer risk, especially in Asian and European population [13].
PCR-RFLP polymerase chain reaction restriction fragment length polymorphism is a technique relies on the fact that some SNP create or delete recognition site for restriction enzyme. Before using restriction enzyme, the region of interest must be amplified using PCR. Then, PCR product can be digest with specific restriction enzyme and according to different alleles (SNP); fragment with different size can be recognize using gel electrophoresis [14]. The aim of this study was to investigate the distribution of alleles of ESR1 in intron 3. The study used RFLP technique for genotyping (rs2347867) in the gene, in which normal allele (G) is replaced with mutant allele (A). In addition, to compare estradiol level between breast cancer patients, control group (obese and normal), and to correlate this SNP to obesity in breast cancer patient.
Human subjects
The study included 119 participants (40-80 years), 60 of them were ER+ breast cancer patients and the rest are control individuals. All participants gave their written informed consent of their participation and filled questioner about their Age, Positive family history of cancer, contraceptive pills consumption, significant psychological stress and early detection of tumors by screening mammography.
Sample collection
Blood samples of participants were taken from King Abdulaziz University Hospital in Jeddah. Whole blood (6 ml) has extracted from both breast cancer and healthy subject. Three milliliter collected into violet Vacutainer tube, which contains EDTA to be used in DNA extraction, and three milliliter of blood has collected in yellow cap tube to be used in determining estradiol level (hormone test). The ethical Committee (unit of biomedical ethics) did the approval of this study at King Abdulaziz University.
Extraction of DNA
DNA was extracted from whole blood that was stored in EDTA coated tubes (Lavender top tube, Franklin Lakes, NJ, USA) using The ReliaPrep Blood gDNA Miniprep System Kit. Promega GoTaq Green Master Mix kit was used for PCR amplification of a region in intron 3 of ESR1 gene containing SNP rs2347867 using two primers; the forward primer (5’ GAAGCGTGGATAATTGGTGTG3’) and the reverse primer (5’ AGAGATTGGGTTGCCCTTTT3’). The primer was designed using primer software primer3 (version 0.4.0). PCR reactions were carried out in a final volume of 25 μl; the amplifications were done using Master cycler Personal (Master cycler Personal, Eppendorf, Germany). After the first denaturation at 95°C for about 4 minutes. PCR was carried out for 30 cycles with 95°C for 15 seconds, annealing at 55°C for 30 seconds, extension at 72°C for 30 seconds and final extension for 7 minutes.
Digestion of DNA using HhaI
Genotyping of SNP determined by Restriction Fragment Length Polymorphism (RFLP) procedure. The reaction done in labelled, clean and dry 1.5 ml microcentrifuge tube by adding; 10 μl PCR product, 18 μl Nuclease Free water, 2 μl 10X Tango Buffer and 1 μl of restriction enzyme HhaI . Then, the tube incubated for 1 hour at 37°C. Finally, the genotyping were resolved after running the samples on 4% agarose gel electrophoresis.
Methodology
In this study (HhaI) restriction enzyme has chosen to allow SNP genotyping. This restriction endonuclease recognizes (5’ GCG^C 3’) sites and cuts best at 37°C in Tango buffer. Therefore, in this case HhaI will cut wild type allele (G) resulting in two fragments of DNA with product size 115/393bp, without effecting variant allele (A).
Measuring estradiol level
The Electro-chem-iluminescence technique was used to measured estradiol (E2) level of both breast cancer and health subjects. This has done in chemistry lab of King Abdulaziz university hospital by lab technician using cobas 6000 analyzer series (Roche, USA).
Statistical analysis
The Statistical package for Social Sciences SPSS has used for data analysis. Numerical data had represented as (mean +/- standard deviation), beside that qualitative variables had represented as frequencies and percentages. In addition, (median +/- interquartile range) had used for not normally distributed variables that had outliers. In addition, some tests had been used for comparing between two or more not normally distributed groups such as, Mann Whitney U test for comparing two different medians, and Kruskal Wallis test for comparing more than two medians. Moreover, Chi-Square test of independency was used to determine whether there was a significant relationship between two categorical variables. These statistical methods were used an alpha of 0.05 which considered as the significant level for making decisions.
The control subjects age were selected to be compatible with patient’s average age. The results of current study showed that the average age of onset for the patients was 53 years and this is equivalent to earlier reports on age of onset in Saudi Cancer Registry which provide that the median age at diagnosis of breast cancer patients was 50 years old [3].The Body mass index (BMI) of both patients and control subjects were calculated by using online calculator in national institution of health. Focusing on obese females with BMI=30.0-39.9, we found high percentage of obesity in both controls and patients data (51.7%) and (56.7%), respectively. A recent study in 2016 based on reviewing previous literature about prevalence of obesity in Saudi Arabia found that obesity is significantly high in the country, in which about 7 out of 10 people suffering from obesity and this expected to increase in future [15].
In presenting study, the percentage of patients with family history of breast cancer in first-degree relatives was 40%, and Chi-square test found significant relationship between breast cancer and family history of breast cancer with p-value (0.001). Study done in 2011 found association between increase breast cancer risk and history of breast cancer in first-degree relatives, and this association increase with increased number of firstdegree relatives’ member. The data indicate a 1.47 to 1.63-fold increased risk of breast cancer in women with one (or more than one) affected relative and a 2.05 to 2.66-fold increased risk in women with at least two affected relatives, compared to women with no family history [16].
Although, the percentage of early detection was higher in patients (18.3%) compared to controls (16.7%), there was no significant relation between breast cancer and early detection of cancer based on result of Chi-square test p-value is (0.843). While the Percentage of contraceptive pill administration was higher in controls, (38.3%) compared to patients (26.7%). Up to 30% of the patients showed psychological affection. The menopausal status of both patients and control subjects has codified from the questionnaire in the consent form; 56.7% of patients were postmenopausal and 53.3% of controls were postmenopausal (Table 1).
| Data (n=119) | Control (n=95) | Patients (n=60) |
|---|---|---|
| Age (years) | 54.28 ± 11.148 (40-87) | 53.8 5 ± 11.179 (29-82) |
| Weight | ||
| Underweight | 1 (1.7%) | (3.30%) |
| Normal | 10 (16.7%) | (5%) |
| Overweight Obesity | 16 (26.7%) | 21 (35%) |
| 31 (51.7%) | 34 (56.7%) | |
| Positive family history of cancer | 7 (11.7%) | 24 (40%) |
| Contraceptive pills | 23 (38.3%) | 16 (26.7%) |
| Psychology | 21 (30%) | |
| Early detection | 10 (16.7%) | 11 (18.3%) |
| Menopause status | ||
| Premenopausal | 27 (45%) | 23 (38.3%) |
| Postmenopausal | 32 (53.3%) | 34 (56.7%) |
| PR | ||
| Positive | 47 (78.3%) | |
| Negative | 8 (13.3%) | |
| Her2 | ||
| Positive | 10 (16.7%) | |
| Negative | 42 (70%) |
Table 1: Demographic Characteristics of Participants (Data were expressed as mean ± SD (minimum–maximum) or number (%) as appropriate; PR (progesterone receptor) and Her2 (human epidermal growth factor receptor 2)).
This study focused on investigating the distribution of ESR1 alleles in breast cancer patients to correlate it to obesity. A polymorphism (rs2347867 G>A +27944) in intron 3 of ESR1 gene was chosen as there are some previous studies associate it with breast cancer. The genotyping results for ESR1 gene in intron 3; demonstrated that the presence of normal allele G was low in patients (11.7%) compared to hetero allele G/A, and mutant allele A (55.0% and 33.3%) respectively, in ER+ breast cancer patients in Jeddah. Figure 1 demonstrate a photograph of 4% (w/v) agarose gel that shows PCR product after amplification of intron 3 in ESR1 gene and DNA bands resulting from restriction enzyme (HhaI) in different breast cancer patients. Line M: DNA marker (100bp ladder). Line1: PCR product after the amplification (519bp). Line 2: Homozygous AA (ESR1/ESR1) mutant allele that produce one band of size 519bp. Line 3 and 5: Heterozygotes AG (ESR1/ESR1) mutant/wild type allele that produces three bands of size 519, 393 and 115 bp. Line 4: Homozygous GG (ESR1/ESR1) wild type allele that produce double bands of size 393 and 115 bp. From this result, we can conclude that there may be an association between polymorphism in intron 3 in ESR1 (rs2347867 G>A+27944) and breast cancer risk. Few published studies were looking for a relation between susceptibility to breast cancer progression and different SNPs in ESR1 gene, some of them were focusing on rs2347867 as the current study. In 2009, Yingchun et al. studied distribution of rs2347867 and other 14 SNP loci in ESR1 gene in breast cancer patients. The results shows polymorphisms in many SNP including rs2347867, were other SNPs such as; loci rs872921 and rs3904766 had poor polymorphisms. The study also shows a positive associated between these SNPs and the efficacy of endocrine therapy [17].
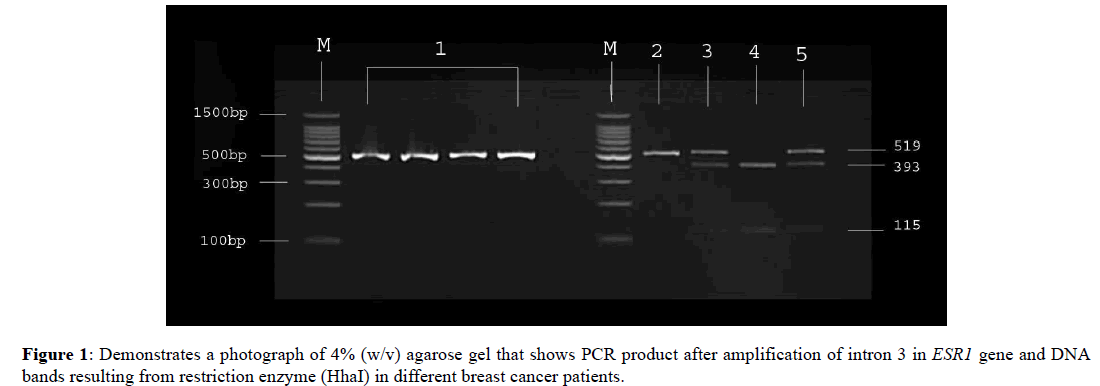
Figure 1. Demonstrates a photograph of 4% (w/v) agarose gel that shows PCR product after amplification of intron 3 in ESR1 gene and DNA bands resulting from restriction enzyme (HhaI) in different breast cancer patients.
PR and HER2 receptors
All the patients were selected as ER+ breast cancer, and the patients PR (progesterone receptor) and Her2 (human epidermal growth factor receptor 2) status were determined from their profile; 78.3% were PR+ and 16.7% were Her2+. Cross table has done between PR and Her2 in ER+ breast cancer patients and its result shows that the highest percentage was in patients whose PR is positive and Her2 is negative. Using Chi-square test of independency to look for significant relationship between PR and Her2 in ER+ breast cancer patients, we found that there is no significant relationship between the two receptors with p-value (0.12).
Estradiol hormone level
After analyzing the estradiol test results of both breast cancer and control, it has been found that hormone level is not normally distributed and had an outliers and large spread. Therefore, we used the least affected measures that are Median and Interquartile Range (Table 2). Mann Whitney U test was used to compare median of two different groups. Different comparisons were done between breast cancer and control subjects whether postmenopausal or premenopausal.
| Median ± IQR (minimum-maximum) | ||
|---|---|---|
| Data (N=119) | Control (n=59) | Patients (n=60) |
| E2 | 39.33 ± 427.35 (15.35 -2844) | 44.5 ± 57.00 (18.35 -2915) |
Table 2: Estradiol level median of both breast cancer and control subjects.
First we compare median of E2 level between premenopausal and postmenopausal in control and patients data separately; there was only significant difference in control data with the p-value (0.000) (Figure 2).
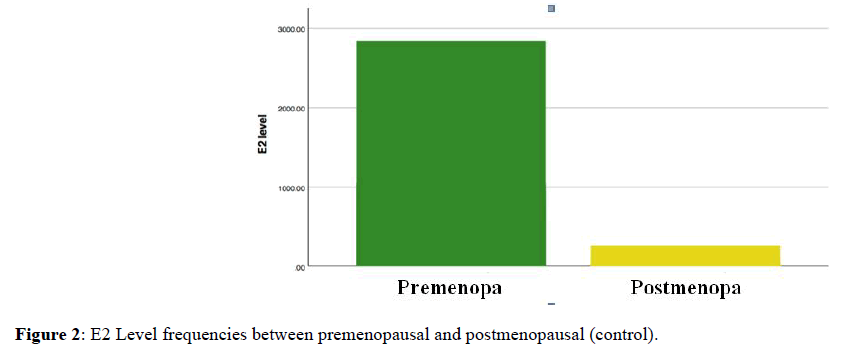
Figure 2. E2 Level frequencies between premenopausal and postmenopausal (control).
In premenopausal women, estrogen hormone is produce primary in ovary, and its level ranging from 100 pmol/L to 1,000 pmol/L. On the other hand, in postmenopausal women estrogen level has decreased to 10 pmol/L to 20 pmol/L. The reason of this reduction is that ovary stop producing estrogen and its synthesis occurs mostly in peripheral tissues, particularly adipose tissue [9]. In this study, among control data the median of E2 level was higher in premenopausal comparing to postmenopausal with a significant difference p-value (0.000). In addition, the result of Pearson correlation coefficient between age and E2 level was (-0.35) which mean there is a negative moderate relationship between these two variables. On the other hand, among patient's data of this study, there were no significant differences between premenopausal and postmenopausal p-value (0.265). Therefore, as the differences disappeared in patients compared to control; we may indicate that there is a relationship between estradiol level and breast cancer.
Then we compared median of E2 level in premenopausal women only, between patient and control data the pvalue show no significant differences p-value (0.105). However, comparing median of E2 level in postmenopausal women only, between patient and control data shows significant differences with p-value (0.000) (Figure 3).
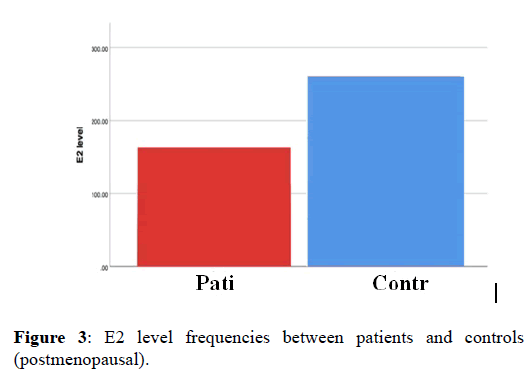
Figure 3. E2 level frequencies between patients and controls (postmenopausal).
In postmenopausal data, median of E2 level was higher in controls compared to patients. When we Re-analyzing control data we found that most postmenopausal women have low estradiol level. Only three of them have high estradiol level (122.50, 166.10 and 259.80 pmol/L), and this elevation of their estradiol is due to the obesity, in which there BMI were (44, 64 and 42) respectively.
Therefore, we considered these three data as outlier result and we reapplied the test after ignoring them; the result also shows significant differences with p-value (0.000), but the E2 level was higher in patients compared to controls. After reanalyzing the control data, our result in this section becomes compatible with other studies that found positive relationship between breast cancer and estradiol level in postmenopausal women. In 2015 study done on 80 breast cancer patients (premenopausal and postmenopausal), conclude that high estradiol level consider as breast cancer risk factor in postmenopausal. On the other hand, the same study found no relationship between estradiol level and breast cancer risk in premenopausal women; which confirm our finding [18] (Figure 4).
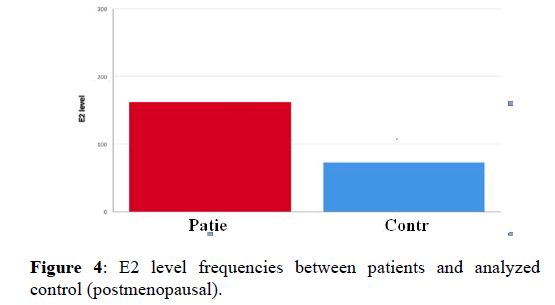
Figure 4. E2 level frequencies between patients and analyzed control (postmenopausal).
Relationship between estradiol hormone and obesity
As estradiol level differs according to menopausal status, we studied the relation between E2 level and obesity based on menopausal status. Mann Whitney U test has applied on patients and controls data-separately with defining their menopausal status. In premenopausal, the results found no significant differences between median of E2 level of obese subjects and median of E2 level of the other weighted groups (underweight, normal and overweight) with p-value (0.317 and 0.483) respectively. The bar graph that demonstrate a relation between E2 level and weight in postmenopausal data, shows a positive relation between the two variables in control but not in patient data; in which the hormone level rises with weight increasing (Figure 5). Although the graph shows a positive relation; when we apply Mann Whitney U test there were no significant differences between median of E2 level of obese subjects with media of E2 level of the other weighted groups in both control and patient data, with p-value (0.311 and 0.325) respectively.
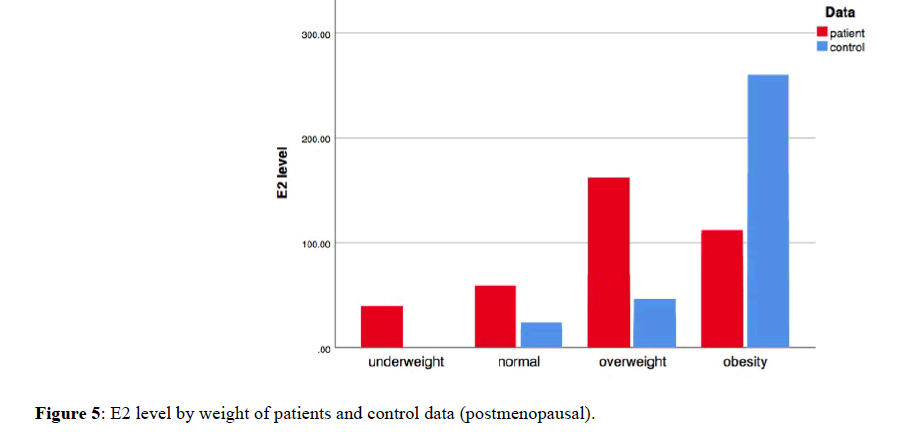
Figure 5. E2 level by weight of patients and control data (postmenopausal).
Freeman et al. published study that examined association between obesity and reproductive hormones in non-breast cancer women. The study based on measuring estradiol level over a 12-year period, to look for hormone differences based on weight and progressed from premenopausal to postmenopausal status. They found that estradiol levels in premenopausal was significantly lower in the obese and the overweight groups compared to the normal BMI, While in postmenopausal the lowest estradiol levels was in normal-weight group and the highest estradiol levels was in obese [10]. We can observe the same result from bar graph that demonstrates relation between E2 level and weight in our study. In which, in premenopausal control data the E2 level was lower in obese and overweigh compared to normal weight. In addition, the bar graph of postmenopausal control data shows a positive relation between E2 level and weights; with higher E2 level in obese compared to overweight and normal weight. Mann Whitney U test results of patient’s data were not compatible with other study that found a positive relation between obesity and estradiol hormone in postmenopausal breast cancer patients [18].
Relationship between estradiol hormone and different alleles
As most of previous study found a relation between BMI and estradiol level in postmenopausal breast cancer patients, we will focus in this section on postmenopausal data only. Kruskal-wallis test had been used for comparison when more than two groups is involved (normal allele, hetero allele and SNP). We compared median of E2 level between the three-genotyping groups in postmenopausal patients and control data separately. The p-value was (0.314) in control and (0.931) in patients (Figure 6). From theses p-vales we analyze that there is no significant differences in median of E2 level between the three-genotyping groups in postmenopausal breast cancer patients.
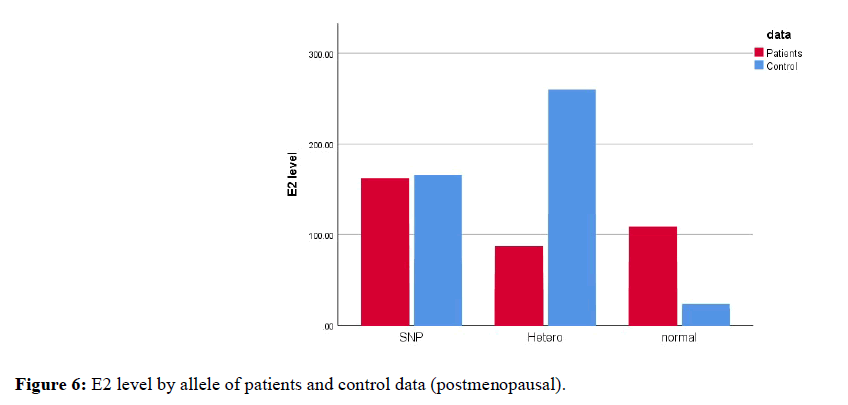
Figure 6. E2 level by allele of patients and control data (postmenopausal).
From the results of current study, we can conclude that there may be an association between polymorphism in intron 3 in ESR1 (rs2347867 G>A+27944) and breast cancer risk. In addition, we confirm the positive relationship between breast cancer diagnosis in postmenopausal women and high estradiol level. However, the study could not associate the alternation of E2 level to obesity or to polymorphism in intron 3 of ESR1. The suggested association between polymorphism rs2347867 and breast cancer risk needs a larger samples to confirm. In addition, we recommend educating population about health hazard of obesity and the importance of maintaining an ideal weight for better health. Finally, we need to increase awareness about importance of breast cancer early detection especially in females whose 50 years or older.
We would like to thanks King Abdulaziz University for giving us the opportunity to carry out this research.
We are thankful to King Abdulaziz City for Science and Technology for financial support for this project.
The authors declared no conflict of interests regarding the publication of the paper.
Received: 24-Oct-2018
Copyright: © 2019 Sabah Abdulaziz Linjawi et al. This is an open access paper distributed under the Creative Commons Attribution License.Journal of Biology and Today's World is published by Lexis Publisher; Journal p-ISSN 2476-5376; Journal e-ISSN 2322-3308.
Sources of funding : King Abdulaziz City for Science and Technology