Research Article - (2025) Volume 14, Issue 1
There is a strong connection between changes in mechanical properties and injuries or diseases. In order to detect the mechanical structure of tissue, techniques like biopsy and manual palpation were developed. However, these methods have many drawbacks. Biopsy is invasive and not reliable, while manual palpation is qualitative, superficial, and dependent on the operator. To address these limitations, elastography emerged as a non-invasive and quantitative way to assess tissue stiffness. This study aimed to explore the use of torsionally-polarized geometrically-focused waves induced by a stepper motor on a test tube, and to investigate whether wave propagation changes when a pre-stretch is applied to the phantom. To achieve this, the study designed a new arrangement where a cylindrical sample was suspended freely in the MRI, allowing for different axial tensile pre-stresses to be applied while simultaneously conducting Magnetic Resonance Elastography (MRE) studies. The measurements obtained through MRE included wave images depicting the displacement field in cross-sectional slices within an isotropic cylindrical phantom under varying pre-stresses. The experimental data was compared to computer simulations using Finite Element Analysis (FEA). This investigation provides valuable insights into tissue mechanics, and offers a way to assess tissue anisotropy and wave propagation under different pre-stress conditions.
Magnetic resonance elastography • Pre-stress, dynamic • Vibration • Wave propagation
Traditionally, to evaluate diseases physicians take advantage of the four senses: Hearing, sound or ausculation, visual perception, smell or olfaction, and manual palpation. In particular, manual palpation is a useful method to assess biological tissue [1]. Indeed, by the sense of touch physicians can estimate qualitatively the response to deformation of the tissue that is evaluated, since mechanical properties of tissues are different among physiological and pathological conditions [2]. Even though this is a powerful method, it is restricted to the body surface; hence the location of pathologies inside the body cannot be located. Besides, this technique is characterized by intraobserver and interobserver variability. The gold standard to determine hepatic fibrosis grade grade is liver biopsy. This method is a procedure characterized by the removal of a small piece of liver tissue, so it is analyzed under a microscope for signs of damage or disease [3]. In particular, the stiffer is the liver, the higher is the grade of fibrosis; on the other hand, a less stiff tissue represents a better condition of the liver. Liver biopsy is characterized by sampling errors given by the small size of the hepatic samples and the non-homogeneity of liver fibrosis. Other limits of this technique are the intraobserver variability and the risk for the patient since it can cause pain, making the subject uncomfortable. Moreover, after the biopsy can occur bleeding and some bacteria might penetrate the abdominal cavity leading to infection [4].
The method’s limitations mentioned have led to the development of different methods such as elastography. Elastography is a non invasive and quantitative remote palpation technique, it is very sensitive to pathological changes since it can evaluate stiffness deep inside the tissue [5]. Therefore the mechanical properties of biological tissue are a fundamental aspect for diagnosis. In the case of elastography, the main approaches to provide imaging of the mechanical properties are ultrasound elastography and Magnetic Resonance Elastography (MRE). Ultrasound elastography is not expensive and is versatile. This method works by combining traditional ultrasound technique with mechanical vibration to the tissue examined, such that stiffness can be assessed. Regarding the measured physical quantity, this method can be divided into strain imaging and shear wave imaging [6]. In the first category, the normal strain is evaluated by applying normal stress to the tissue. Instead, in shear wave imaging is used a mechanical vibrating device to apply dynamic stress to the tissue considered. In this way, the shear wave speed and shear modulus are measured [7]. MRE is a dynamic and quantitative imaging technique that evaluates the shear modulus (stiff-ness) of biological tissues through the analysis of mechanical waves with a particular magnetic resonance technique [8]. Exploiting harmonic mechanical excitation shear waves are created; thus, they propagate in-depth in the biological tissue, and the shear modulus of tissue is estimated. Moreover, knowing that the stiffness is a function of density and the mechanical wave speed; the stiffer is the material, the larger is the wavelength, hence the faster is the velocity of propagation of the wave through the tissue. In this work the mechanical behaviour of an isotropic phantom was evaluated during Magnetic Resonance Elastography (MRE) applying torsional vibrations at rest and during pre-stresses conditions. The wave images obtained performing MRE were then validated and compared with computer simulations of the experiment using Finite Element Analysis (FEA).
Mechanical parameter assessment
The wave images that are estimated could be used as a powerful tool to calculate mechanical properties using mathematical inversion algorithms [9]. Among the mechanical properties, for clinical application, it is estimated the shear modulus of a medium represented as a complex quantity, in which the real part is the storage modulus and the imaginary part is the loss of modulus that represents the attenuation of the considered viscoelastic sample [10]. The shear modulus is given by the product between the density (in MRE for a tissue is around 1000 kg/m3) and the wave speed. Since the speed wave is the product between the operating frequency and the spatial wavelength of the shear wave, the algorithms are implemented to estimate the wavelength such that the shear modulus can be assessed. In MRE the result of the mechanical properties of tissue considered are images, called elastograms that represent both the real and imaginary components of the shear modulus.
Initially, the wave equation of a linear elastic continuum is obtained, followed by the extension of the concept to a transversely isotropic model that imitates skeletal muscles [11]. In MRE, only the analysis of shear waves is significant since compression waves cannot be detected in the region of interest of the medium considered. The complex shear modulus is obtained by applying a discrete fourier transform to the equation of motion.
Various viscoelastic models are explored to reproduce the viscoelastic behavior of the muscle, which helps in estimating tissue properties [12]. MRE can measure the mechanical properties of the tissue by describing how mechanical waves propagate in the material using wave equations. The equation of motion has different solutions, and therefore it is necessary to describe the different types of mechanical waves that differentiate how they propagate in the solid.
Two types of body waves are found in a continuum, namely shear and compression waves. Compression waves are also called longitudinal waves, where the volume of the basic elements changes while the particle displacement is parallel to the direction of propagation. In contrast, in shear waves, the volume elements that compose a wave do not change, and the particle displacement is perpendicular to the direction of wave propagation. Surface waves are a combination of longitudinal and transverse waves, and there are Rayleigh and Love waves in a solid. Compression waves are neglected in MRE experiments as their wavelength is higher compared to shear waves, which have a shorter wavelength and are more damped than compression waves. In biological tissues, the wave speed of compression waves is around 1500 m/s, while the wave speed in shear waves is slower, around 1-10 m/s [13].
Magnetic resonance elastography
MRE is a phase-contrast MRI technique capable to develop quantitative maps depicting the mechanical properties of biological tissues [14]. The main steps of MRE techniques are: The application of a harmonic force to the tissue; measurement of the resulting internal displacements of the tissue and lastly, determining the viscoelastic properties of the biological tissue by solving the equation of motion that replicate the behavior of the tissue of interest.
MRE is used to evaluate viscoelastic shear properties of biological tissues by applying mechanical vibrations to them and detect then the response of the tissue through MRI. Data processing in this case is characterized always by an inverse problem, obtaining information about the spatial distribution of elastic parameters from the displacement field [15]. There are different methods to reach this objective, and they differ from noise, boundary conditions and the property parameters of the tissue, such as viscosity, anisotropy and heterogeneity. There are two types of approaches: The direct problem and the inverse problem. The direct problem can estimate the behavior of a medium if the parameters µ, λ and the boundary conditions of the surface of the system are known. The most used inverse method is the scalar Helmholtz equation that determines shear modulus, which is related with the phase velocity of the wave equation [16]. In MRE taking into account the tissues as a linear elastic isotropic body, characterized by local homogeneity, such that boundary conditions and stress field are neglected, can solve the inverse problem.
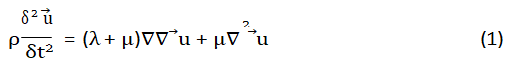
The wave equation (1) needs the knowledge of 3D displacement because the equation for the individual components is coupled.
Transforming (1) into the frequency domain through the discrete fourier transform and by assessing the elastic-viscoelastic analogy, which affirms that if the elastic solution of the wave equation is available, then the viscoelastic solution can be obtained in the frequency domain by replacing the elastic moduli with the corresponding complex (viscoelastic) moduli (2):

In which GL(ω) and Gs(ω) are the complex moduli representing the first and second Lam´e parameters respectively, ω the angular mechanical frequency and is U(ω) the Discrete fourier transformation of the displacement [17]. Assuming incompressibility (∇ â U(ω)=0), the shear modulus is obtained from (2)
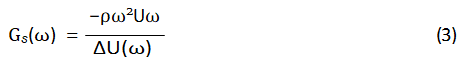
The latter relation represents the scalar Helmholtz inversion. It is used by assuming the out of phase plane displacement into two dimensional elastography and it returns an exact solution to the inverse problem considering the isotropy of the medium and local homogeneity.
In general a table top MRI scanner is a tool that demonstrates different concepts like magnetic resonance, spatial encoding or Fourier transform. In MRE is used in combination with a mechanical vibration in order to estimate elastograms. There are different types of low-cost table top imaging systems. In this work is exploited pure device 0.5 T table top system from Germany. Moreover, the efficient and compact design give the opportunity to be used also in laboratory settings, since it gives the chance to examine different samples [18]. The system includes a magnet with a magnetic field of 0.5 T; gradient coils used for imaging, which produce a magnetic field in the z direction; Gradient Power Amplifier (GPA) which is needed to supply current to the gradient coils; and the Radio Frequency (RF) subsystem to guarantee RF transmission and reception. Lastly, Matlab was used to conduct the experiments and generate wave images.
Table top system
The setup used it is characterized by the MRI benchtop 0.587 T system (Pure devices GmbH, Wu¨rzburg, Germany) that comprise of:
• The control driver
• The 0.587 T (25 MHz) magnet (magspec)
• The pre-amplifier
• The high-power gradient amplifier (DC-600)
• The RJ-45 adapter connected to the actuator
• The actuator supports and sample holder
The magnet case is not perfectly symmetric with respect to the bore and the reference of the system has the y axis aligned with the axis of the sample considered (Figure 1).

Figure 1. Reference system in the table top MRI scanner.
Stepper motor setup
MRE includes the generation of mechanical vibrations, which are created by the application on the system of external driver devices. To develop an electrical signal is used a signal generator, which is triggered by and coincident to the MR pulse sequence, which is fed into the mechanical driver and then, through an audio amplifier, the MR pulse sequence is increased.
MRE actuators differ from the type of vibration source is used to create motion. One of the requirements for these driver systems is to not cause an interaction with the magnetic fields, present in the MRI system [19]. Another aspect to consider is that the radio frequency and gradient coils generate time varying magnetic fields that could lead to the presence of eddy currents in some electrically conductive components of the transducers. These eddy currents create image artefacts and heat of the transducers.
Typical excitation frequencies used in MRE for clinical applications range from 20 to 100 Hz. Since it is important to guarantee a proper transfer of the wave energy onto the region of interest of the tissue are necessary a high wave amplitudes. Hence, regarding the tissue that is analyzed, the position and the design of the transducers vary. For this study a stepper motor was used to generate torsional vibration. The set up was characterized by a black rod, which was connected to a rotating disk that created the torsional vibration of the sample. Moreover, to reduce attenuation at higher frequencies, it was used a steel coupler composed of two sets of screws on its top and bottom end, such that the first pair was connected to the rotating shaft and the second pair is attached to a component made of VeroClear. The other half of this latter piece was wrapped around the plastic rod, used to hold the test tube. Inside the test tube, there was inserted a sample, which was placed at a certain height in the region of interest of the table top system. The set up was then constituted by the stepper motor attached to an acrylic support base that is then leaned to the table top MRI system (Figure 2).

Figure 2. Setup composed by stepper motor, with the black plastic rod, the VeraClear component that connect the coupler to the rod and the acrylic support base.
Isotropic phantom ans setup components: The phantom was fixed and connected to the stepper motor through the adapter, a 3D printed structure, with a length of 90 mm and made of Siraya®Tech Blu. It was constituted by two equal and symmetric parts, such that when the phantom was ready, the two pieces were glued together Figure 3C.
The phantom used in this work was made of Ecoflex™00-30, a material soft enough to mimic the muscle and soft biological tissue. In order to obtain the sample, the first step was to stir part A and part B, then in a container was poured and mixed a 1A:1B by volume or weight mix ratio. After about three minutes of mixing, there was a vacuum degassing phase, to eliminate entrapped air. When this last phase was finished, the mixture was poured on a designed mold and it was cured for four hours at room temperature with negligible shrinkage. The phantom at the top features a flange, to have a more robust connection to the rest of the setup (Figure 2).
Moreover, while the phantom cures at the bottom part was inserted an anchor (Figure 3A) 30 mm long, made of Siraya®Tech Fast created. The phantom has a length of 120 mm a diameter of 8 mm with the flange has a 12 mm diameter. In addition, to make sure that the anchor was fixed to the bottom part of the sample, it was applied a silicone modified conformal coating by MGchemicals® to the anchor. The purpose was to hang through a fishing line (KastKing Superpower Fishing Line, 6LB 327Y DS) different bullet weights, in order to analyze how shear waves propagates in a pre-strain sample. It was created an endcap (Figure 3B), with Siraya®Tech Fast, as an additional system to guarantee the attachment of the anchor to the phantom.

Figure 3. (A): 3D illustration of the weight anchor; (B): 3D illustration of the endcap; (C): Illustration of the adapter.
An upside down diagram of the whole phantom setup is represented in Figure 4, characterized by the anchor, the endcap and the Ecoflex™00-30.

Figure 4. Upside down diagram of the mold used to create the Ecoflex™00-30 phantom. The dark grey component is the endcap, the grey part is the anchor and in yellow is represented the Ecoflex™phantom, which is placed inside the mold.
Setup with weights: In Figure 5 is represented the stepper motor setup was also analyzed by elongating the phantom by 10% and 20% of its initial length with some weights. The bullet weights are made of lead, a non-magnetic material, thus it was possible to hang them to the anchor, through a fishing line, causing an elongation of the sample. The motion has been analyzed for the same range of frequency from 200 Hz to 1000 Hz, with a 10% and 20% elongation from the initial length of the phantom.

Figure 5. Stepper motor setup with the weights.
In this study, a computational simulation was conducted using the ABAQUS software to validate experimental results of an isotropic phantom under at-rest and pre-stress conditions. The phantom was approximated as a cylinder with an 8 mm diameter and a length of 120 mm. The simulation utilized a direct approach, with mechanical properties of Ecoflex™00-30 (outlined in Appendix A) as inputs and wave images as outputs. The phantom is assumed to be composed of incompressible isotropic material that exhibits elastic deformation under small strains (e.g. 0.5 Poisson’s ratio), with a density similar to that of water (e.g. 1000 kg/m3). The experimental torsional vibrations were implemented in ABAQUS to the top region of the phantom using a linear perturbation for harmonic stimulation. The cylinder was meshed using hexahedral elements and triangular prisms in transition regions, with mesh size dimensions of 0.2 along the axis of the cylinder and 0.4 for the two bases to optimize computational efficiency and avoid memory limitations (Figure 6). Mechanical vibrations were specifically targeted towards the upper region of the phantom, resulting in a partition face located 10 mm from one of the extremes to simulate the identical experimental behavior. The application of cylindrical coordinates allowed the boundary condition to be solely applied to the previously created 10 mm region and a displacement of 0.1 in the circumferential direction was then applied to the cylinder during its rest condition and at 10% and 20% of elongation.

Figure 6. Mesh of the geometry.
Motion examination
Polytec Portable Digital Vibrometer (PDV-100) was used to demostrate that there was motion transmitted to the sample during the analysis. It is a portable digital laser vibrometer and it gives accurate measurements of the vibration velocities in a frequency range that reaches 22 kHz. In general, a Laser Doppler Vibrometer (LDV) is a tool capable of making vibration evaluations being non-in contact with the surface considered. The working principle of the LDV is based on the Doppler effect, which allows to acquire the vibration velocities. The laser beam projected by the LDV is aimed at the sample’s surface and this causes a shift of the Doppler frequency of the reflected laser beam because of the vibration of the sample itself. In the end, the result is a voltage value directly proportional to the velocities of the target over the laser beam’s direction [20]. A reflective tape was attached to the sample, so that the light beams are reflected and measurements can be done, in order to analyze vibration. The LDV is connected then to a dynamic signal analyzer Agilent 35670A that evaluates mechanical vibration applied on the phantom and characterizes control systems or network analysis. Both axial and torsional vibration were tested and measured. Results are showed in Tables 1 and 2. From these results it was possible to demonstrate that there was enough motion transmitted to the phantom.
| f (Hz)† | A (mm/s)‡ | Displacement (mm) |
|---|---|---|
| 200 | 2.1806 | 0.00174 |
| 300 | 0.1556 | 0.00008 |
| 400 | 2.1449 | 0.00085 |
| 500 | 4.7794 | 0.00150 |
| Note: †Frequency; ‡Amplitude | ||
Table 1. Displacement measured during axial excitation by Agilent 35670A.
|
f (Hz)† |
A (mm/s)‡ |
Displacement (mm) |
|
200 |
20.15 |
0.0160 |
|
300 |
123.92 |
0.0657 |
|
400 |
215.73 |
0.0687 |
|
500 |
16.42 |
0.0052 |
|
Note: †Frequency; ‡Amplitude |
||
Table 2. Displacement measured during torsional excitation by Agilent 35670A.
Stepper motor actuator
Excitation with no pre-strain: Experiments were done then with the stepper motor setup and shear waves were analyzed at 200 Hz, 400 Hz, 600 Hz and 800 Hz and 1000 Hz. In Figure 7 are showed the experimental results at 400 Hz, as an example, in which the real imaginary part and absolute-phase part are represented in x and z direction respectively.

Figure 7. Waves images for 400 Hz. On the left, top row: Real part; top bottom: Imaginary part. On the right, top row: Absolute values; top bottom: Phase values.
Excitation with pre-strains: The setup was also analyzed by elongating the phantom by 10% and 20% of its initial length with the lead weights, using the anchor attached to the phantom, as showed in Figure 5. The motion has been analyzed for the same range of frequency from 200 Hz to 1000 Hz, with a 10% elongation from the initial length of the phantom. In Figure 8 is illustrated the wave images in the x and z direction for 400 Hz. Then, the phantom has been analyzed for 20% elongation. The results at 400 Hz gained are pictured in Figure 9. In this case, the diameter of the phantom is reduced, because of the application of the weights.

Figure 8. Waves images for 400 Hz with 10% elongation. On the left, top row: Real part; top bottom: Imaginary part. On the right, top row: Absolute values; top bottom: Phase values.

Figure 9. Waves images for 400 Hz with 20% elongation. On the left, top row: Real part; top bottom: Imaginary part. On the right, top row: Absolute values; top bottom: Phase values.
Computational analysis
To analyze the motion and display the real part of displacement, a path was created perpendicular to two wave fronts. One wavefront was along the diameter and the other along the generatrix of the cylinder. As the material examined is only elastic, the imaginary part is null. The field output was specified to U1, corresponding to the direction along the length of the cylinder, to analyze differences among the rest position and the 10% and 20% pre-stretch conditions for each frequency (200 Hz-1000 Hz). In Figure 10 is represented the displacement behavior of waves propagation for 400 Hz as an example.

Figure 10. Example of displacement behavior of the waves propagation along the U1 direction for 400 Hz, when the cylinder is at its rest condition and at both 10% and 20% of its elongation.
Table 3 displays the main characteristics of wave displacement, which help to comprehend the outcomes of computational simulations. The wavelength denotes the distance between two peaks of a wave and is directly related to the frequency of a given form. This correlation is expressed in the formula: λ=v/f. Waves with longer wavelengths have lower frequencies, while those with shorter wavelengths have higher frequencies. On the other hand, the amplitude of a wave is the distance between the highest point (peak or crest) and the lowest point (trough) of the wave. In this study, both parameters were calculated using the obtained graphs. The wavelength was determined by counting the number of wavelengths that constituted the wave, which was measured by highlighting the crests of the wave displacements. Denoting x as the variable for the number of wavelengths per frequency, the equation used was: xλ=120 mm.
| Frequency (Hz) | Wavelength (mm) | Amplitude (mm) | ||
| 0% | 10% | 20% | ||
| 200 | 24.0 | 0.12 | 0.04 | 0.02 |
| 400 | 13.3 | 0.26 | 0.10 | 0.04 |
| 600 | 8.50 | 0.36 | 0.15 | 0.07 |
| 800 | 6.30 | 0.35 | 0.30 | 0.25 |
| 1000 | 4.20 | 0.38 | 0.15 | 0.13 |
Table 3. Table in which wavelength and amplitude values are calculated for each frequency evaluated. Highlighting the different pre-stretch conditions.
There are some improvements and considerations that can be made in this study. First of all, in order to understand better the behaviour of the phantom during torsional excitation more experiments and analysis should be done. For example, further analysis should be focused on an anisotropic phantom, in order to mimic in a better way the mechanical properties of muscle tissue. Finally, once the new setup is validated for transmitting torsional vibration, few upgrades can be made in its design. For example, a better means of coupling the specimen, whether it be a phantom or excised biological tissue, to the actuator could improve measurements. For soft tissue specimens an alternate way of securing an anchor to the tissue is needed to stretch it for tensile loading. For any design improvements one must remember to utilize only non-magnetic components and to keep in consideration the design constraint of fitting things within the 10 mm vertical bore of the tabletop MRI.
The aim of this research study was to design and test a new experimental configuration to generate and measure torsionally polarized and axially-polarized radially-converging shear wave motion in a cylindrcially shaped soft tissue phantom under varying axial tensile pre-stress conditions. This involved developing a new tissue phantom fixture that allowed for controlled simultaneous tensile pre stress and a new mechanism for torsional excitation to improve upon the bandwidth limitation of the current stepper motor configuration. The planned experimental approach also was computationally simulated using Finite Element Analysis (FEA) to gain insight into how different parameters affect the generated shear wave field in the phantom. The torisonally-polarized motion detection can be broken down into two Cartesian directions in the tabletop MRI system, the x (1) direction and the z (3) direction. Initial motion encoding measurements in these directions using the stepper motor have identified some challenges associated with the new phantom configuration. Slight eccentricity in the phantom geometry or how it’s affixed to torsional driver can result in rocking or other types of non torsional motion that will need to be reduced or filtered out to improved measurement capability. Additionally, the vibration was not sufficiently transmitted to the phantom at higher frequencies of interest, because of low resonance frequency of the system. For this reason, a computational analysis was necessary to deepen wave propagation inside the phantom. From the results gained in the computational simulation is observed that there is an effect on the wave propagation varying both frequency and pre-stresses. Moreover, quantitatively values of both wavelength and amplitude of the wave in the U1 direction were calculated from the graphs. Overall, from these images, a sinusoidal behavior was detected. In Table 1 is clear that, as expected, by increasing the frequency the wavelength decreases, indeed for 200 Hz the wavelength is 24 mm, and for 1000 Hz corresponds to 5.2 mm. Also, is understandable that as the pre stress increases the amplitude of the wave decreases along the axis of the cylinder. For example, for 400 Hz the amplitude when a stress is not applied is equivalent to 0.26 mm, instead when the cylinder is subjected to 20% of pre-stretch corresponds to 0.04 mm.
I would like to thank Professor Pasquale Vena, Royston and Klatt for showing his help and support throughout the development of my research and for welcoming me at UIC, providing me the possibility to stay another semester in Chicago and to work in the acoustics and vibration laboratory, at UIC. I would like to thank my laboratory’s college at the acoustic and vibrations lab, for welcoming me and taught me MRE experiments
The authors declare that there are no competing interests.
[Crossref] [Google Scholar] [PubMed]
[Crossref] [Google Scholar] [PubMed]
[Crossref] [Google Scholar] [PubMed]
[Crossref] [Google Scholar] [PubMed]
[Crossref] [Google Scholar] [PubMed]
[Google Scholar] [PubMed]
[Crossref] [Google Scholar] [PubMed]
[Crossref] [Google Scholar] [PubMed]
[Crossref] [Google Scholar] [PubMed]
[Crossref] [Google Scholar] [PubMed]
[Crossref] [Google Scholar] [PubMed]
[Crossref] [Google Scholar] [PubMed]
[Crossref] [Google Scholar] [PubMed]
[Crossref] [Google Scholar] [PubMed]
[Crossref] [Google Scholar] [PubMed]
[Crossref] [Google Scholar] [PubMed]
[Crossref] [Google Scholar] [PubMed]
[Crossref] [Google Scholar] [PubMed]
[Crossref] [Google Scholar] [PubMed]
Citation: Dibennardo F, et al. "Magnetic Resonance Elastography: Multi-Directional Excitation in a Table Top MRI System and Finite Element Simulations of Harmonic Excitation Experiments". J Biol Todays World, 2025, 14(1), 1-7.
Received: 26-Sep-2023, Manuscript No. JBTW-23-114882; Editor assigned: 28-Sep-2023, Pre QC No. JBTW-23-114882 (PQ); Reviewed: 12-Oct-2023, QC No. JBTW-23-114882; Revised: 13-Jan-2025, Manuscript No. JBTW-23-114882 (R); Published: 20-Jan-2025, DOI: 10.35248/2322-3308.25.14(1).004
Copyright: © 2025 Dibennardo F, et al. This is an open-access article distributed under the terms of the Creative Commons Attribution License, which permits unrestricted use, distribution, and reproduction in any medium, provided the original author and source are credited.