Research Article - (2023) Volume 5, Issue 1
Purpose: The aim of this work is to evaluate the influence of implant dimensions on the stress distribution of implant-supported mandible utilizing 3D finite element analysis. Materials and Methods: Six finite element models for the completely edentulous patient were created which corresponded to three different implant diameters (2.9, 3.4, and 3.9 mm) and two implant lengths (11 and 15 mm) grouped into six groups. The models were composed of a core of cancellous bone layer surrounded by a 2mm cortical bone layer, mucosal layer, dental implant vertically placed in the canine area, and an implant-supported overdenture. The models were loaded with 35 N vertical load and 10 N horizontal load; all loads were applied to the first molar of the prosthesis. Results: von Mises stresses were numerically situated at the implant neck. The use of a larger diameter or longer implant decreases the maximum stresses within the alveolar bone. Conclusion: Implant parameters affect load transmitting mechanism to the alveolar bone. The results suggested that the use of wider and longer implants as could as accommodated by the ridge might ensure a better biomechanical environment for both the implant and alveolar ridge.
Implant Dimensions • Alveolar Bone • Supported Mandible • Edentulous Patient • 3D Finite Element Analysis
An increasing rate of edentulism and partial edentulism among the elderly has been noticed and is attributed to the shifting of the age pyramid and an increase in the elderly population [1]. Edentulous patients with a brutally resorbed mandible regularly experience troubles such as insufficient stability with their conventional dentures due to an obstructed loadbearing limit [2-4]. Over the past decades, rehabilitating edentulous patients with endosseous implants has shown excellent long-term results. The treatment has demonstrated high predictability and has further encouraged clinicians to extend the indications to partially edentulous individuals decreasing stress at the alveolar crest is the aim of various implant treatments to reduce bone loss which is a concerted phenomenon with implants [5-6]
Several methods are available for the prediction of stresses around dental implants including strain measurement, photoelasticity, and 2D and 3D Finite Element Analysis (FEA) [7-11]. FEA is one of the most fruitful geometrical/computational approaches and most valuable analysis tools in both engineering and medicine since the 1960s [12]. Currently, FEA is utilized popularly by investigators to predict unknown biomechanical phenomena of orthopedics, and dental implants [13-16]. The aim of this work is to study the influence of implant dimensions on the stress distribution of implant-supported mandibles using 3D finite element analysis.
The 3D Geometry of Solid Models
Rubber base impressions were made to the upper and lower arch of the completely edentulous patient, poured with self-cure acrylic resin. A rubber base impression was taken by injection of a light body impression material around the transfer copings then a full-arch impression was recorded with a heavy body material.
Upper and lower wax bite blocks were prepared with the locator processing caps embedded in the lower bite block, placed on the master cast, and mounted on a semi-adjustable articulator, then anatomical acrylic artificial teeth were set in balanced, harmonious occlusion. The lower trial denture base with the incorporated locator caps was flaked, packed, finished, and polished in the usual manner. The ball abutments were tightened to the implant on the self-cure acrylic resin model and the denture was seated as shown in Figure 1. Each duplicated acrylic resin model received a different implant size, and then the steps were repeated and grouped (Table 1).
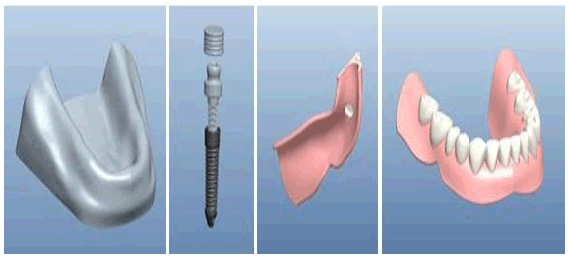
Figure 1: 3D geometry of (a) the lower edentulous acrylic resin model, (b) dental implant, and (c & d) the implant-supported overdenture of each group
Table 1. Dimensions of the implant in each model
| Model | Dimensions | |
|---|---|---|
| Diameter | Length | |
| A | 2.9 mm | |
| B | 3.4 mm | 11 mm |
| C | 3.9 mm | |
| D | 2.9 mm | |
| E | 3.4 mm | 15 mm |
| F | 3.9 mm | |
In this study, the 3D geometry of the lower edentulous acrylic resin model, dental implant, and the implant-supported overdenture of each group was transferred using the Computer-Aided Design (CAD system – Pro-Engineer program). Each model of the six groups consisted of five solids: cancellous bone bordered by a 2 mm cortical bone layer, mucosal layer, implant- abutment, and acrylic resin overdentures as shown in Figure 2.
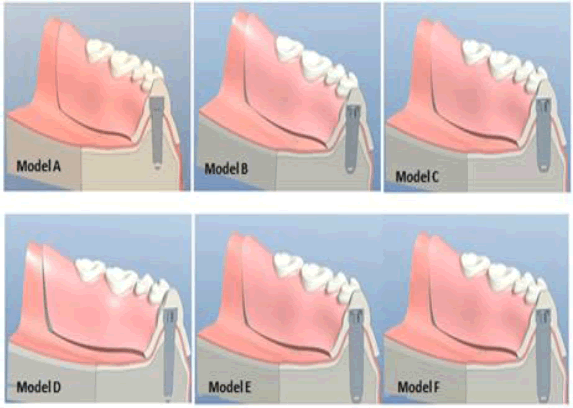
Figure 2: 3D-solid model of the six groups with the five layers
The Finite Element Models
After the creation of the 3D-solid models, the six models were then imported into FE code (MSC Patran software) to create the FE models as shown in Figure 3. Each layer of the FE models (5 layers) was discretized into a mesh of smaller and simpler elements connected at their nodes. A finite element mesh was generated using 10-node tetrahedral 3D-solid elements for half of the model. In each FE model, the total elements in each model were 48278 and the total number of nodes was 80872 nodes. All nodes of the bottom surface were totally restricted for any movement in any direction (translation or rotation around x-, y-, and z-directions) as shown in Figure 4. Nodes of the back and lateral surfaces were not allowed to move in x-, and ydirections. Other nodes in the model have 3 DOF (in the x-, y-, and zdirections).
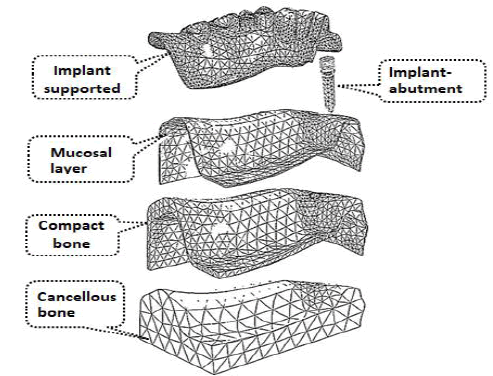
Figure 3: FE Model with the number of elements and nodes in each solid of the model
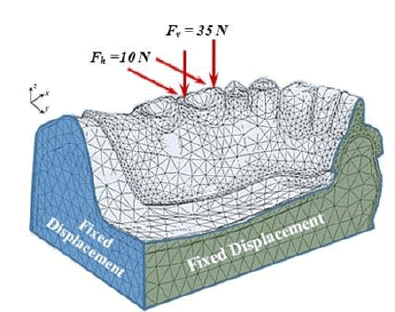
Figure 4: Boundary conditions of the bottom, back, and lateral surfaces of the FE model.
Several studies have thought that the load applied to the implant is in three directions, horizontal, vertical, and oblique. Tada utilized horizontal and vertical loads of 50 N and 100 N, respectively with no oblique load. While Oliveir utilized A 30° oblique load of 150 N. Meijer utilized a horizontal load of 10 N, a vertical load of 35 N, and a 120° oblique load of 70 N. Yokoyama utilized an occlusal load of 100 N at an angle of 30° from the vertical axis. Patil and Abdelhamid utilized 100 N vertical and 100 N at 20° oblique loads [17-22].
In this work, the mastication load is then applied to the prosthesis. The models were loaded by 35 N vertical load (z-direction) and 10 N horizontal load (y-direction); all loads were applied to the first molar of the prosthesis. All the layers used in this work are assumed to be linear, isotropic, and homogeneous. The elastic properties of the layers (young’s modulus and poisons’ ratio) are listed in Table 2. The final step of the FE analysis is to solve the completed models utilizing Nastran solver to obtain the nodal displacements and then the resulting von Mises stress values. The results are then imported again to the finite element program (Patran interface) for viewing the von Mises stress distribution.
Table 2. Elastic properties of model materials
| Layer | Young’s Modulus (MPa) | Poisson’s ratio |
|---|---|---|
| Cancellous bone | 1370 | 0.3 |
| Compact bone | 13700 | 0.3 |
| Mucosa | 2.8 | 0.37 |
| Acrylic resin | 3200 | 0.35 |
| Titanium | 110000 | 0.35 |
In this study, the implant–abutment length and diameter are set as design variables. Distribution and maximum von Mises stress of implantsupported overdenture layer, cancellous bone, compact bone, and implant–abutment is chosen as response variables. FE results of the six models demonstrated unequal von Mises stress distribution within the bony socket of the loaded implants. The FE nodes show the maximum von Mises stresses are located around the neck of the implant at the compact bone mainly at the Bucco-distolingual rim of the bony socket; this location was identical for all groups considered.
The von Mises stress distribution, which is the main factor used in the FE analysis to summarize the total stresses was visualized via color scales, the range of stress for each color was identified on the colored bar on the right of each output of the FE result. The area indicated in red color represents the area with the highest von Mises stress value (peak stress), while the area indicated in white color represented the area with the lowest von Mises stress value. The statistical analysis of the von Mises stress values was also performed [7, 23].
Figure 5(a-d) shows the von Mises stress distribution in the implantsupported overdenture layer, cancellous bone, compact bone, and implantabutment for the 6 FE models, respectively. The output data are showing the maximum stress values for the 4 layers in the 6 models located around the implant neck. The estimated maximum von Mises stresses are listed in Table 3. FE output results within the implant-supported overdenture layer (Figure 5a), of the 6 models revealed that the maximum von Mises stress value is higher (22 MPa) in model A. whereas the stress value is less (14.7 MPa) in model E. In the same manner, the maximum stress values of the compact and cancellous bones are higher in model A (14.9 MPa and 8.63 MPa, respectively) than that in model E (10.2 MPa and 2.14 MPa, respectively). FE data within the implant–abutment of the models revealed that the maximum stress value is high in model B (30 MPa) and low in model C.
Figure 5a.: von Mises stress distribution in the supported overdenture layer of the FE Models
Figure 5b: Mises stress distribution in the compact bone of the FE models
Figure 5c: von Mises stress distribution in the cancellous bone of the FE models
Figure 5d: von Mises stress distribution in the Titanium implant–abutment of the FE models
Table 3. Maximum von Mises stress of the FE models
|
FE Layer (Part) |
Implant diameter | Implant length | ||
|---|---|---|---|---|
| 2.9 mm | 3.4 mm | 3.9 mm | ||
|
Overdenture layer |
11 mm | 22 | 18.7 | 17.2 |
| 15 mm | 17.1 | 15.4 | 14.7 | |
|
Compact bone |
11 mm | 14.9 | 12.9 | 10.9 |
| 15 mm | 10.8 | 10.5 | 10.2 | |
|
Cancellous bone |
11 mm | 8.63 | 7.3 | 4.1 |
| 15 mm | 4.1 | 3.92 | 2.14 | |
For a better understanding of the effects of input variables (length and diameter of implant–abutment) on response variables (Distribution and maximum von Mises stress), the main effects plots are drawn (Figures 6 and 7). Figure 6 shows the effect of implant length on the 2.14 Figure 5b. von Mises stress distribution in the compact bone of the FE models Figure 5c. von Mises stress distribution in the cancellous bone of the FE models Figure 5d. von Mises stress distribution in the Titanium implant–abutment of the FE models Figure 5(a-d) shows the von Mises stress distribution in the implantsupported overdenture layer, cancellous bone, compact bone, and implantabutment for the 6 FE models, respectively. The output data are showing the maximum stress values for the 4 layers in the 6 models located around von Mises stress values within the implant-supported overdenture layer, cancellous bone, and compact bone. The FE results in the entire figure revealed that maximum von Mises stresses in all parts (overdenture layer, cancellous bone, and compact bone) displayed a decreasing trend as the implant length increased. The decreasing trend in the models with an 11 mm diameter is higher than the models with a 15 mm diameter in all layers. It is remarkable that the effect of implant length is more notable in the case of 11 mm diameter than that in the case of 15 mm diameter.
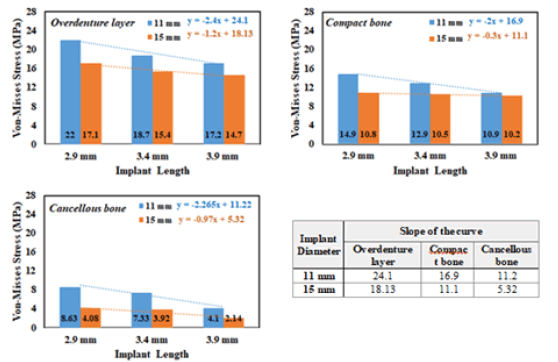
Figure 6: Effect of implant length on the maximum von Mises stress within the implant-supported overdenture layer, cancellous bone, and compact bone, Average sum of the slope of the curve of all the implant length as mentioned above
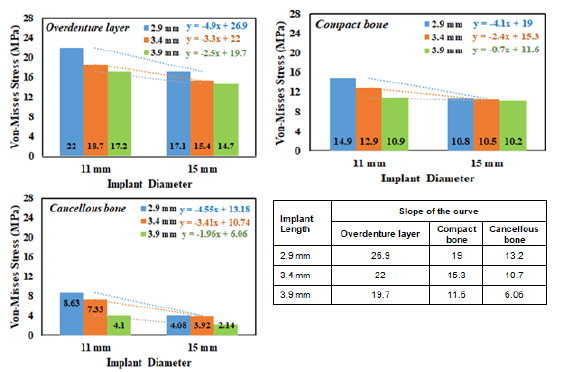
Figure 7: Effect of implant diameter on the maximum von Mises stress within the implant-supported overdenture layer, cancellous bone, and compact bone, average sum of the slope of the curve of all the implant diameters as mentioned above.
It can be seen in these figures that there is a remarkable difference in the estimated maximum stress values of the FE simulation with an 11 mm implant diameter, as compared with the maximum stress values of the models with a 15 mm implant diameter. The same tendency was observed with the three layers, overdenture layer, cancellous bone, and compact bone. In the models with an 11 mm implant-abutment diameter, the difference between the maximum stresses in the overdenture layer for models A and B is about 15 %. Whereas the difference between the results in models B and C is 8 %. In addition, in the models with 15 mm implant-abutment diameter, the difference between the results in models D and E and between the results in models E and F are 10 % and 5 %, respectively (Table 4).
Table 4. Comparison of maximum von Mises stresses within the layers in the FE models
| Dimensions | L = 11 mm | L = 15 mm | ||||
|---|---|---|---|---|---|---|
| Layers | Model A | Model B | Model C | Model D | Model E | Model F |
| Overdenture Layer | 22 MPa | 18.7 MPa | 17.2 MPa | 17.1 MPa | 15.4 MPa | 14.7 MPa |
| 15% | 10% | |||||
| 8% | 5% | |||||
| 22% | 14% | |||||
| Compact Bone | 14.9 MPa | 12.9 MPa | 10.9 MPa | 10.8 MPa | 10.5 MPa | 10.2 MPa |
| 13% | 3% | |||||
| 16% | 3% | |||||
| 27% | 6% | |||||
| Cancellous Bone | 8.63 MPa | 7.3 MPa | 4.1 MPa | 4.1 MPa | 3.92 MPa | 2.14 MPa |
| 15% | 4% | |||||
| 44% | 45% | |||||
| 52% | 48% | |||||
Figure 7 shows the effect of implant diameter on the von Mises stress values within the implant-supported overdenture layer, cancellous bone, and compact bone. The FE results discovered the same trend in the case of different implant lengths exposed in the case of different implant diameters. The FE results discovered the same trend in the case of different implant diameters shown in the case of the different implant lengths. The maximum stresses are higher in the models with a small diameter (11 mm) than that models with a 15 mm diameter.
In this study, the FEA was chosen as it was very difficult to accomplish analytical mathematical solutions for the complicated geometries of the human bone, dental implant, and overdenture except with a numerical method such as the finite element. Additionally, 3D-FEA was used despite its complexity as it was more accurate and presentative of stress behavior on the supporting bone than 2D-FEA [24-27]. 6 FE models were created to investigate the influence of the implant dimensions on the von Mises stresses within the alveolar bone of the supported mandible. Each FE model consisted of a cancellous bone encircled by a 2 mm cortical bone layer, two implants placed vertically in the canine area, and acrylic resin implant-retained overdenture. The design of the screw implant was selected as it minimizes the micromotion of the implant and improves the initial stability [28].
Though numerous works are investigating the influence of implant design and dimensions on stress distribution, nevertheless most of these works utilize schematic FE models [16, 18, 20, 28-35]. The FE results of this study indicated that the maximum von Mises stress is located around the neck of the implant mostly at the Bucco- a distolingual edge. This place is identical for all implant models considered in this study. With a comparison of the models (Figures 6 and 7), with the same implant length, the computed von Mises stresses were decreased as the implant diameter increased within both compact and cancellous bones [16, 36]. Niroomand and Arabbeiki stated that increasing implant diameter has a direct effect on the von Mises stresses at the bone-implant interface. At the same time, a comparison of the models with the same diameter but increasing lengths showed that the computed von Mises stresses decreased as the implant length increased within both compact and cancellous bone.
Baggi, Himmolva, Gumrukcu, and Korkmaz stated that increasing implant length was associated with decreasing stresses around the dental implants. Niroomand and Arabbeiki observed that increasing the implant length has little effect on the compact bone. On the other hand, Pierrisnard stated that the stresses within the bone were almost constant, independent of implant length. The FE results of our work revealed that, at the compact bone level, increasing the implant diameter has a substantially and statistically significant effect on decreasing stresses than increasing the implant length, however, at the cancellous bone level, increasing implant length has a substantially and statistically significant effect on decreasing stresses than increasing the implant diameter [16, 28, 36-38].
The FE results in all the FE figures revealed that the maximum von Mises stresses in the layers (overdenture layer, cancellous bone, and compact bone) displayed a decreasing trend as the implant diameter and length increased. In addition, the results demonstrated that the maximum von Mises stress levels were located around the implant neck. In the improvement of stress distribution, increasing implant diameter is a more efficient design parameter than increasing implant length.
Citation: El-Morsy A.W. et al. Influence of Implant Dimensions on Stress Distribution within Alveolar Bone of Supported Mandible Using 3D Finite Element Analysis. J Dent Res Pract. 2023, 5 (1), 001-005
Received: 08-Jan-2023, Manuscript No. JDRP-23-86149; Editor assigned: 10-Jan-2023, Pre QC No. JDRP-23-86149 (PQ); Reviewed: 12-Jan-2023, QC No. JDRP-23-86149(Q); Revised: 02-Feb-2023, Manuscript No. JDRP-23-86149(R); Published: 21-Feb-2023, DOI: DOI: 10.4172/jdrp.23.5(1).034
Copyright: ©2023 El-Morsy A.W. This is an open-access article distributed under the terms of the Creative Commons Attribution License, which permits unrestricted use, distribution, and reproduction in any medium, provided the original author and source are credited.