Research Article - (2023) Volume 12, Issue 4
The behaviour of water confined e.g. in artificial meso-or nanoporous silica materials are intensively discussed in literature. In this paper, we present the results of Dynamic Mechanical Analysis measurements of water confined in biological systems (foods like e.g. bread, apple, turkey bone, etc.) as a function of temperature and frequency and compare them with results of water confined in artificial mesopores. Two types of cooling/heating protocols were used: Slow (2 K/min) cooling/heating runs and quenching the samples from room temperature to 100 K prior to slow heating up to room temperature. We found striking similarities between the behaviour of water confined in mesoporous silica and biological systems, both, in the vicinity of the glass transition as well as in the freezing/melting transition region. The obtained results are discussed, using artificial meso or nanoporous materials as a model system for advancing our understanding of the freezing and glass transition of water confined in foods and other biological systems.
Mesoporous materials • Dynamic mechanical analysis • Glass transition temperature • Freezing and melting transition • Biological systems
Meso or nano-confined water plays an important role in geochemistry, materials science, as well as in biological systems. The phase change of water occurring in foods and other biological systems during freezing and melting includes complex processes at the macro and micro levels. During the past decades, many investigations have shown that water confined in nanometre-sized artificial pores displays quite different behaviour as compared to bulk water [1-11]. There is general consensus, that the freezing-melting transition temperatures Tf, Tm decrease with decreasing pore size [1-3,9,12]. Quite similarly, the glass transition temperature Tg of water decreases with decreasing pore size for a wide range of pore sizes [1,2,12,13]. This behaviour is more pronounced for larger pores, attaining an almost constant value of Tg for smaller pores, i.e. below approximately 2-3 nm [1,2,13]. Some authors explain this behaviour as follows: For larger pores, a reduction in Tg is given when the length scale d of the confinement becomes comparable or smaller than that of the Cooperatively Rearranging Regions (CRRs) accompanying the glass transition [13,14]. This confinement induced acceleration of the dynamics is suppressed, when the size of the pores becomes smaller, so that the effect of the interactions between the confined liquid and the pore wall prevails, which counteracts the decrease of Tg.
Rather controversial results have been obtained by different authors concerning the glass transition temperature Tg of bulk and confined water. E.g. values of Tg for bulk water range from the traditional value of Tg ≈ 136 K up to 210 K [1-3,13,15].
Quite recently, we have performed detailed dynamic elastic and thermal expansion measurements regarding the freezing/melting transition as well as the glass transition of water in meso-and nanoporous silica [1-3].
In the present work we study the behaviour of water in biological systems (foods) when cooled to low temperatures. How does the cooling rate affect the mechanical properties of foods, the formation of crystalline structure of water confined in foods below the freezing point, or the amount of water that turns into a glassy state? Although some of these questions have been recently addressed, the behaviour of water confined in foods is much less studied than in artificial nanopores [16-19].
One of the effective methods for studying the dynamic elastic properties of materials is Dynamic Mechanical Analysis (DMA). It is also used in the research of biological systems [20-22]. In this work, we used DMA to study the behaviour of water in biological systems and based on our results of water confined in mesoporous silica materials give an explanation of the processes that occur in biological systems during the transitions of water into ice and glassy state at low temperatur es [1-3].
Meso-porous materials
Since for our studies macroscopic samples of a few mm are needed, we used monoliths of mesoporous silica, i.e., Vycor and Gelsil with the following Table 1 characteristic parameters.
| Properties | V10 | G5 |
|---|---|---|
| Pore size (nm) | 10 ± 0.5 | 5 ± 0.8 |
| Porosity (%) | 40 | 54 |
| Surface/volume ratio | 4.5 | 8.3 |
| Pore surface area (m2/g) | 90 | 510 |
Table 1. Characteristic data of meso-porous silica monoliths.
A diamond saw was used to cut the samples of Vycor and Gelsil with typical sizes of 3 × 2 × 2 mm3. The samples were sanded to gain parallel surface plains. The geometrical accuracy of the polished samples was better than 10 μm. Then the samples were cleaned by first dropping them into a 30% H2O2 solution at 90°C for 24 h, followed by drying at 120°C in a high vacuum chamber also for 24 hours. The complete filling of the samples was done by making use of the strong capillary forces of the narrow pores, i.e. dropping the sample on one end (to avoid air-bubbles) into water until the opaque empty sample gets fully transparent. For partly filled samples, the following procedure was applied: First, the samples were fully filled. Then, they were heated up to 25°C (for Vycor 10 nm) and 35°C for Gelsil (5 nm) and kept at these temperatures for 10 min. The empty samples were produced by heating them up to 150°C for 10 min. Temperature dependent measurements (not shown here) of thermal expansion proved that the samples were partly filled (i.e., no thermal expansion anomaly due to the formation of ice in the pores) or completely free of water (no thermal expansion anomaly at all), depending on the foregoing procedure.
Dynamic Mechanical Analysis (DMA)
At DMA measurements a dynamic force FD .sin(ɷτ) is applied in addition to a static force Fs, i.e. with (FD<Fs). The real (Y') and imaginary (Y'') parts of the complex Young´s modulus Y*=Y'+iY'' are determined from the measured sample strain ε=Δ L/L0 and phase shift ẟ between the externally applied dynamic force and the sample strain using the relation.
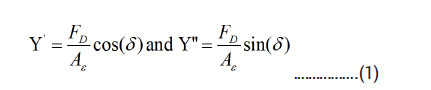
where A is the sample area, which in parallel plate geometry is in contact with the tip of the DM A apparatus.
The measurement frequency can be varied between 0.01 Hz and 100 Hz at temperatures between 80 K and 870 K. A force up to 10 N can be applied, with a resolution of 0.002 N. The resolution of the sample height is about 3 nm and the phase shift ẟ can be measured with an accuracy of about 0.1°. The relative accuracy of the DMA method is about 0.2%-1%, but the absolute accuracy of such a measurement is usually not better than about 20%. More details about the experimental method can be found in Salje and Schranz [23].
The behaviour of water in mesoporous silica (Vycor, size of pores 10 nm, porosity 40% and Gelsil, size of pores 5 nm, porosity 54%) and biological (bread, apple, turkey bone, etc.) systems was studied using dynamic mechanical analyzers (Diamond DMA, DMA-7 and DMA-8000) in a wide temperature range (100 K-300 K) and for different frequencies (0.05 Hz-70 Hz). In all cases, except for turkey bone, Parallel Plate (PP) geometry with sample dimensions of 6 × 4 × 4 mm3 was used (Figure 1). Three-Point Bending (TPB) geometry was used for turkey bone investigation with sample dimensions of 20 × 4.4 × 1.05 mm3. A sinusoidal force with various frequencies (frequency range from 0.05 Hz-70 Hz) was applied to the samples, and the measured response is presented here in terms of the real and imaginary parts of the complex Young’s modulus Y*(ɷ)=Y' (ɷ)+iY'' (ɷ).

Figure 1: (a) Parallel Plate (PP) and (b) Three-Point Bending (TPB) geometries of DMA experiments.
Figure 2 shows the real (Y') and imaginary (Y'') parts of the complex Young´s modulus of water in Vycor (a) and white bread (b) as a function of temperature at slow cooling (2 K/min) and heating. Both porous structures contain similar amounts of confined water (Vycor ≈ 40%, white bread ≈ 38%). In both samples, the real part Y' of the complex Young’s modulus, shows distinct changes in the freezing/melting (Tf/Tm) and glass transition (Tg) regions with corresponding peaks in the imaginary (Y'') parts, respectively. Large changes of Y' near Tf/Tm and small changes near Tg indicate that most of the water freezes into an ice structure and only a small portion transforms into a glassy state. More details will be discussed below. Of course, changes in Y' of water in bread in the glass transition region are much smaller than in Vycor, due to the differences in the stiffness of the matrix where water molecules are confined. In both cases the amount of water is about 40% at room temperature but the Vycor glass matrix is much harder (Y' ≈ 60 GPa) than bread (Y' ≈ 0.1 GPa). The freezing-melting transition shows a clear temperature hysteresis in both materials.

Figure 2: (a) Temperature dependencies of real (Y′) and imaginary (Y″) parts of the complex Young’s modulus of water in Vycor (10 nm pore diameter, 40% water)
and (b) bread (38% water), measured at slow cooling and heating (cooling/heating rate 2 K/min). Measurement frequency 1Hz. Note: ( ) Cooling, (
 )
Heating.
)
Heating.
The situation changes drastically when we quench (100 K/min) the samples to about 100 K. In this case, some layers of water molecules near the pore surface do not have enough time to create a crystalline structure (ice) and turn into a glassy state (Figure 3). This is, because the dynamics of water molecules closer to the pore walls is known to be slower, compared to the core of the pores [24,25]. During further slow heating of the samples, this water again turns into a liquid state above the glass transition (Tg), characterized by a decrease in Y'. With further heating, the water molecules again start to create a crystalline structure (ice). This crystallization is accompanied by an increase in the Young´s modulus Y'. It is more pronounced in biological systems, where the soft matrix of these systems cannot limit the volume growth of the crystalline structure during the transition of water from liquid state to ice.

Figure 3: (a) Temperature and frequency dependencies of real (Y′) and imaginary (Y″) parts of the complex Young´s modulus of water in Vycor 10 nm and (b) bread,
measured at heating (heating rate 2 K/min) after samples were quenched to 100 K. Insets show the shifts of the relaxation anomalies in Y′ and Y″ with different
frequencies near the glass transition temperature. Note: ( ) 1 Hz, (
 ) 5 Hz, (
 ) 10 Hz.
The transition of water into a crystalline structure occurs up to the melting point (Tm), where the crystalline structure again transforms into a liquid state, characterized by a large jump in Y' and a frequency independent peak in Y''.
We observe an even more pronounced increase in the real part of the Young’s modulus in a mesoporous material with larger porosity (Gelsil 5 nm, 54% confined water) and apple (84% water), i.e. with larger amount of supercooled water recrystallizing prior to melting (Figure 4).

Figure 4: (a) Temperature and frequency dependencies of real (Y′) and imaginary (Y″) parts of the complex Young´s modulus of water in Gelsil 5 nm and (b) Apple,
measured at heating (heating rate 2 K/min) after the samples were quenched to 100 K. Insets display the shifts of the relaxation anomalies in Y′ and Y″ with different
frequencies near the glass transition temperature. Note: ( ) Cole-Cole fit.
We detected quite similar behaviour of biological materials with even larger water content (74%-93%), i.e. small changes (softening) with increasing temperature in the real part Y' of the Young´s modulus in the region of the glass transition with its subsequent huge growth up to the melting temperature (Figure 5). Moreover, slow cooling of biological systems followed by slow heating shows usually only changes near the melting/freezing transition. The reason is-as it was already mentioned above-during slow cooling almost all water turns into ice.

Figure 5: Temperature dependencies of real (Y′) and imaginary (Y″) parts of the complex Young´s modulus of water in biological systems with large water content; (a)
Measured at heating (heating rate 2 K/min) after samples were slowly (2 K/min) cooled to 100 K. Note: ( ) Bread (water: 38%), (
 ) Potato (water: 79.8%), (
 ) Apple
(water: 84%). (b) Biological systems, measured at heating (heating rate 2 K/min) after samples were quenched to 100 K. Note: () Banana (water: 74%), () Apricot
(water: 86%), () Sweet pepper (water: 91%), (
) Apple
(water: 84%). (b) Biological systems, measured at heating (heating rate 2 K/min) after samples were quenched to 100 K. Note: () Banana (water: 74%), () Apricot
(water: 86%), () Sweet pepper (water: 91%), ( ) Onion (water: 93%).
On the other hand, during rapid cooling, most of the water molecules turn directly into a glass state with subsequent transition at slow heating into a supercooled liquid state and subsequent crystallization of supercooled water up to the melting temperature.
We also performed measurements on porous silica samples partially filled with water (Figure 6). To do so, we completely filled the sample with water, followed by its evaporation from the middle part of the pore, leaving only a few layers of water on the walls of the pores where the rate of evaporation is very low. Using these samples, we effectively probed the behaviour of water molecules in the vicinity of the pore walls. As a result, we obtained merely changes of Y' in the region of the glass transition with corresponding peaks in the imaginary part Y'' of the complex Young´s modulus and no freezing was detected.

Figure 6: (a) Temperature and frequency (0.1 Hz - 70 Hz) dependencies of real (Y′) and imaginary (Y″) parts of the complex Young´s modulus of Monolayer (ML) water in Gelsil 5 nm. Note: ( ) Cole-Cole fit, (
 ) 0.1 Hz, (
 ) 1 Hz, (
 ) 10 Hz, (
 ) 70 Hz. (b) of turkey bone (6%-10% water content), measured at heating (heating rate 2 K/min) after slow cooling to 100 K. Note: () Cole-Cole fit, () 0.1 Hz, () 1 Hz, () 10 Hz, () 40 Hz.
We found the same behaviour of water when studying turkey bone which has a low water content of 6%-10%.
From Arrhenius plots (using the peaks in the imaginary part Y'' of the complex Young´s modulus) activation energies Ea of water relaxation processes in the glass transition region were found. For mesoporous silica filled with water as well as for biological materials, the activation energy is Ea ≈ 0.5 eV (Table 2), which indicates the similarity of the processes in the region of the glass transition for both systems. This value of the activation energy of water relaxation in the glass transition region corresponds quite well to the literature values for e.g. bread, cellulose, Vermiculite clay, onion, etc [6].
| Material (% water) | Ea[eV] | a |
|---|---|---|
| Vycor 40% | 0.52 ± 0.04 | 0.52 ± 0.01 |
| Gelsil 54% | 0.48 ± 0.04 | 0.44 ± 0.01 |
| Bread 38% | 0.46 ± 0.008 | 0.6 ± 0.012 |
| Apple 84% | 0.48 ± 0.17 | 0.78 ± 0.3 |
| Gelsil (monolayer water) | 0.47 ± 0.12 | 0.86 ± 0.008 |
| Turkey bone 6%-10% | 0.49 ± 0.04 | 0.87 ± 0.006 |
Table 2. Parameters of cole-cole relaxation function from fits of the data. τ0 ≈ 10-16-10-18 s.
In addition, we also used a symmetric Cole-Cole (C-C) function to describe the relaxation processes
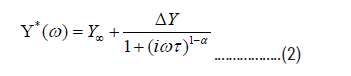
where Y* is the complex elastic modulus, ω is the angular frequency, α-width parameter (α takes a value between 0 and 1) and is a relaxation time (τ=τ0 exp(Ea/kBT)). Using Eq (2) we fitted the changes in real part of Young’s modulus and peaks in imaginary part of Young’s modulus of all samples with corresponding activation energies (Ea) and other parameters (Table 2). These values also support the similarity of relaxation processes in porous glasses and foods near the glass transition.
In the following we will discuss the behaviour of water in artificial porous materials for different cooling rates (Figure 7). It is well known, that water in nanopores can be roughly separated into a layer of bound water and core water [24,26]. The bound water is believed to remain unfrozen (no ice structure) even down to ~ 190 K. The thickness t of the non-freezable layer is found to be between t ~ 0.3 nm and ~ 0.6 nm that, roughly, corresponds to one or two monolayers of water molecules. Beyond this layer, water molecules still remain strongly structured by the pore walls of silica up to a distance of ~ 1 nm from the pore wall. The mobility of this shell of water molecules is signifcantly lower, compared to that of bulk water. Solely the core region beyond ~ 1 nm from the pore wall is believed to be similar to that of bulk water, i.e. in terms of mobility and density. Therefore, it is likely that upon slow cooling the water molecules in the core region will form a crystalline ice structure (Figure 7) below the freezing point of water. But due to the mentioned differences in different water layers, not all water in the pores turns into ice. Between the ice and the walls of the pore, there remain 1-2 layers of supercooled water, which pass into the glass state below Tg. With subsequent slow heating, the bound water changes from a glassy state to a supercooled liquid state, which is accompanied by a softening of the elastic modulus (Figure 2). When the melting temperature Tm is reached, the ice in the center of the pores turns into liquid (Figure 2).

Figure 7: Sketch of the freezing/melting and glass transition behavior of confined water for slow (top) and fast (bottom) cooling rates.
The effect of the non-freezable layers of water molecules also shows up in the modified Gibbs-Thomson (G-T) relation, which describes the melting point depression as
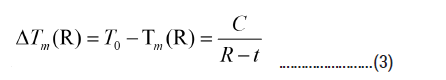
where T0 is the melting temperature of bulk water, R is the pore radius and t is the thickness of the non-fr eezable layer of water molecules.
DSC and Raman measurements of water confined in ordered silica nanopores MCM-41 with pore diameters between 2 and 9 nm yielded C=63 ± 8 Knm and t=0.6 nm, which indeed corresponds to about two monolayers of non-freezable water molecules [6].
With fast cooling (quenching by ca. 100 K/min), the above mentioned shell region of water molecules (additional to the 1-2 layers of unfreezable molecules) with lower mobility cannot pass to the crystalline state (Figure 7). These additional layers of supercooled water remain liquid in the pores between pore walls and ice structure, which finally pass into the glass state below Tg. During subsequent slow heating, these layers form a supercooled liquid, which is again accompanied by a softening of Y’ (Figures 3 and 4). With further slow heating some of these layers form ice (Figure 7) up to the melting temperature, as can be seen (Figures 3-5) by the pronounced increase of Y’ in this temperature range. At Tm the drop in Y’ and the frequency independent peak in Y'' characterize the melting of the entire ice in the pores.
Figure 8 shows the melting temperature as a function of the cooling rate Trate. The observed decrease of Tm(R) with increasing cooling rate can be explained using the modified G-T relation (3), i.e. by assuming (as mentioned above) that the thickness t(Trate) of the non-freezable layer increases with increasing cooling rate. As a consequence, the amount of ice in the core of the pores decreases with increasing cooling rates. Interestingly enough, a very similar behaviour is also obtained for water in foods.

Figure 8: Melting point Tm depression of water confined in nanoporous silica and foods for various cooling rates Trate. Note: ( ) Apple, (
 ) Linear fit, (
 ) Gelsil
2.6 nm, (
) Gelsil
2.6 nm, ( ) Gelsil 5 nm, (
 ) Vycor 10 nm, (
 ) Bread.
In contrast to artificially designed nanoporous materials, the cellular structure in biological systems leads to a much more complex environment for water molecules. Despite of these differences our results indicate that water in biological systems behaves quite similarly as compared to artificially confined pore water. A sketch of the situation is shown in Figure 9. During slow cooling, almost all water molecules turn into ice (Figure 2). But quite similar as in artificially confined water a small part of nonfreezable water turns into a glassy state.

Figure 9: Sketch of the behavior of water in biological cells at low temperature.
With fast cooling (quenching) of the foods, probably the water that is around the plant cell objects has a slower dynamics as compared to the water molecules that are far from the plant cells. As a result the molecules do not have enough time to arrange into a crystalline (ice) state, and transform into a glass state (Figures 3 and 4). With subsequent slow heating, water changes from a glassy state to a supercooled liquid state (Figure 9), which is accompanied by a softening of the elastic modulus (Figures 3 and 4). With further heating, this water molecules form a crystalline structure with a corresponding increase in volume, resulting in a pronounced increase in the modulus of elasticity (Y’). When the melting temperature is reached, the ice turns into liquid, similarly as in silica porous materials.
Already 60 years ago Mazur proposed to describe the intracellular ice formation in a biological capillary pore of a cell membrane by the Kelvin equation, which is very similar to the Gibbs-Thomson equation (3), thus corroborating our present findings [27].
Figure 10 shows how the results on water in mesoporous materials can be used to advance our understanding of the behaviour of water in biological materials. In a recent work we have determined the amount of ice that turns into liquid at heating after slow cooling (2 K/min), for Vycor 10, Gelsil 5 and Gelsil 2 [2]. It yields a linear dependence (Figure 10) of Tm vs. water content (%). Using the present results of Tm for white bread and apple (Figures 2 and 4) and put it on the line, we obtain a fair estimate for the amount of water that freezes to ice after slow cooling. Quite similar results are obtained for the freezing transition at Tf. Unfortunately, at present we cannot perform a similar detailed analysis for quenching experiments, since we do not know the amount of water that turns into ice for quenching experiments of water confined in mesoporous silica. However, preliminary estimations comparing the shifts of Tm of Figure 5 indicate that the amount of ice in quenched biological samples is much smaller compared to the slowly cooled samples.

Figure 10: Amount (%) of ice in silica nanopores and biological systems vs. melting temperature for slowly cooled (2 K/min) samples. Note: ( ) Linear Fit.
Ice formation in biological tissues and foods was studied in some detail, but the glassy behaviour of water confined in biological systems has been scarcely investigated.
In the present work we have studied a variety of foods (white bread, apple, banana, apricot, sweet pepper, onion, etc.) using Dynamic Mechanical Analysis in a wide range of temperatures, at different frequencies and cooling rates (2 K/min and 100 K/min) and compared the data with new and recent DMA measurements of confined water in mesoporous silica.
It is found that the freezing/melting transitions of water in these biological systems are shifted to lower temperatures, similar as for confined water in porous glasses. Moreover, the confinement induced depression of the melting temperature as well as the amounts of supercooled water and ice depend strongly on the cooling rate, both for water confined in artificial mesopores as well as in the food membranes.
Fitting the data near the glass transition region Tg with Cole-Cole relaxation functions yielded similar parameters (activation energies, relaxation times, width parameters) for water in biological systems and in nanopores.
Based on these striking similarities, we propose to consider the relaxational and freezing/melting behaviour of water in biological systems from the point of view of its behaviour in meso and nanoporous artificial materials like Vycor or Gelsil glasses, etc.
Conceptualization: VS and WS; Methodology: VS; Formal analysis: VS and WS; Investigation: VS; Resources: WS; Data curation: VS; Writingoriginal draft preparation: VS; Writing-review and editing: VS and WS; Project administration: WS; Funding acquisition: WS.
This research was funded by the AUSTRIAN SCIENCE FUND (FWF), grant number P28672-N36.
“Not applicable” for studies not involving humans or animals.
The authors declare no conflict of interest.
[Crossref] [Google Scholar] [PubMed]
[Crossref] [Google Scholar] [PubMed]
[Crossref] [Google Scholar] [PubMed]
[Crossref] [Google Scholar] [PubMed]
[Crossref] [Google Scholar] [PubMed]
[Crossref] [Google Scholar] [PubMed]
[Crossref] [Google Scholar] [PubMed]
[Crossref] [Google Scholar] [PubMed]
[Crossref] [Google Scholar] [PubMed]
[Crossref] [Google Scholar] [PubMed]
[Crossref] [Google Scholar] [PubMed]
[Crossref] [Google Scholar] [PubMed]
[Crossref] [Google Scholar] [PubMed]
[Crossref] [Google Scholar] [PubMed]
[Crossref] [Google Scholar] [PubMed]
[Google Scholar] [PubMed]
[Crossref] [Google Scholar] [PubMed]
[Crossref] [Google Scholar] [PubMed]
Citation: Soprunyuk, V., & Schranz, W., et al. Glass and Freezing Transition of Supercooled Water Confined in Mesoporous Materials and Biological Systems. J Biol Todays World, 2023,12(4), 001-010
Received: 05-Jun-2023, Manuscript No. JBTW-23-101434; Editor assigned: 09-Jun-2023, Pre QC No. JBTW-23-101434 (PQ); Reviewed: 23-Jun-2023, QC No. JBTW-23-101434; Revised: 30-Jun-2023, Manuscript No. JBTW-23-101434 (R); Published: 07-Jul-2023, DOI: 10.35248/2322-3308-12.4.001
Copyright: © 2023 Soprunyuk V, et al. This is an open-access article distributed under the terms of the Creative Commons Attribution License, which permits unrestricted use, distribution, and reproduction in any medium, provided the original author and source are credited.