Mini Review - (2022) Volume 4, Issue 3
Introduction: The procedures for treatment with external radiotherapy are very precise. However, there are many sources of error which operate during the planning and delivery of treatment; that limit accuracy. The difficulty of reproducing the positioning of the patient from day to day is a major source of error which must be given special attention. This geometric precision is an essential parameter in the radiotherapy of cancers nasopharyngeal cancer, and the determination of the margin between the CTV and the PTV is the result of the calculation of these uncertainties.
Objective: The aim of this work is to assess the positioning accuracy of patients on the treatment table on a daily basis and to describe the method of calculating systematic and random errors, in order to establish appropriate margins from the CTV to the PTV for the patients.
Materials and methods: Deviations positioning were analyzed in 16 patients irradiated for nasopharyngeal cancer by radiotherapy with VMAT, analyzing their images portals acquired by the CBCT 3D Elekta XVI ®, for 33 sessions establishment, is calculated the overall mean Displacement (M), the Systematic Errors (Σ) and the Random Errors (σ), the PTV margins were calculated according to the Van Herk formula (2.5 Σ+0.7 σ).
Results: A total of 528 portal images were analyzed for nasopharyngeal cancer cases, the M value was 2.7 mm in all directions, the Σ and σ values were 1.3 mm and 5.1 mm respectively, so the calculated PTV margin was 6.82 mm.
Conclusion: In the daily clinical routine for nasopharyngeal cancer patients, the PTV-CTV margins of 7 mm are safe and adoptable, however one could afford in some special situations such as proximity to organs at risk and high dose areas, to put lower margins.
Nasopharyngeal cancer • CTV • PTV • CBCT method • Radiotherapy • IMRT • VMAT
Radiotherapy is a technique most often used to treat cancer using ionizing radiation. This technique not only slows down the tumor process, but also destroys malignant cells and therefore makes the tumor disappear .The procedures for treatment with external radiotherapy are very precise. However, there are many sources of error which operate during the planning and delivery of treatment; that limit accuracy. The difficulty of reproducing the positioning of the patient from day to day is a major source of error which must be given special attention. This geometric precision is an essential parameter, at the same level as good dosimetric planning to ensure the quality of a treatment. Numerous studies have been carried out on the dramatic consequences that can lead to errors in patient positioning, these studies highlight the interest of regularly monitoring the patient's position in relation to the required dose and to make a correction if necessary by the after. These positioning deviations are of two types: systematic and random.
The former are the result of cumulative deviations during the treatment planning process and are reflected in all treatment sessions. And the random deviations vary from day to day and represent unpredictable positioning uncertainty. To account for these potential movements, the International Commission on Radiation Units and Measurements (ICRU) has proposed with the advent of three-dimensional conformational radiotherapy, the definition of a forecast target volume Planning Target Volume (PTV), which takes account of this repositioning uncertainty. Van Herk et al. identified around ten sources of potential errors in the treatment chain and were thus able to establish a formalism allowing to calculate from a homogeneous patient group, margins, guaranteeing with a probability of 90% the presence of the target volume anatomo-clinical Clinical Target Volume (CTV) in isodose 95% (according to the calculated systematic and random errors) [1].
PTV is a necessary safety margin to ensure that the CTV receives the prescribed dose. This geometric concept is a support for the planning and evaluation of treatment plans. It includes the CTV+an internal margin (ITV) + a positioning and repositioning margin.
We first describe the issue relating to the repositioning of patients during the treatment of nasopharyngeal cancer, then we present the means Materials and techniques used to detect patient repositioning errors, finally, we end with the methods aim to quantify the geometric uncertainties for 16 patients.
Patient positioning reproducibility issue:
Planning radiation therapy is based on an anatomical imaging computed tomography (CT SCAN) of the patient at a time t0. The treatments are spread over five to seven weeks of irradiation, at the rate of one daily session, five days a week. Deviations can then occur caused by errors in the positioning of the patient on the treatment table or by anatomical variations (tumor melting, weight loss, edema, change in position and / or organ volumes, etc.); these are inter-fraction variations. Intra-fraction variations including internal physiological movements (breathing, swallowing, heartbeat, etc.) should also be considered. Treatment planning can thus not be representative of the treatment actually delivered because deviations may cause undesirable events such as in back age to tumor volumes but also overdoses to healthy tissue. This situation can result in a decrease in tumor control and / or an increase in toxicity to healthy tissues. The success of a treatment depends largely on the precision in the repositioning of the patient or more exactly on the volume to be irradiated in relation to the isocenter of the machine. Practitioners use different means of restraint and tracking to reproduce the patient's initial position as faithfully as possible. The most common method uses lasers mounted in the treatment room. At each session, the patient is positioned by aligning these lasers with tattoos drawn on his skin. Tattoos are made during the acquisition of planning images. They establish the reference system for tracking. While it guarantees reproducibility of the position of the external structures, this method does not make it possible to control the positions of an internal organ where the displacements can be significant. These trips are due, in particular,
• Target movements;
• Changes in target volume;
• Changes in the shape of the target; • The patient's breathing and morphological changes during the course of treatment [2].
Definition of geometric uncertainties:
The geometric uncertainties on the target are conventionally broken down into:
• Target delineation variability;
• Target movements;
• Changes in target volume;
• Changes in the shape of the target;
• Inaccuracies in repositioning the patient
Furthermore, these geometric uncertainties are associated with two types of error: systematic and random.
Systematic errors: Are propagated throughout the processing. This is the case with errors in delineating the target volume during planning or the difference in position between the target volume on the planning CT and the mean position of that volume during processing. The impact of this latter error on the delivered dose can be simulated by shifting the dose distribution (Figure 1).

Figure 1: Schematic illustration of systematic and random errors [12].
Random-errors: Consist mainly of the patient's setup error and anatomical variations occurring between two irradiation sessions or during one session. The impact of random errors can be simulated by floating the dose distribution (by convolution of the dose distribution with organ position distribution laws) (Figure1).
This study on a heterogeneous series of 16 patients. These patients were treated with IMRT and VMAT in our department. They present nasopharyngeal tumors at different non-metastatic stages. The patients are supine, they have benefited from a personalized 5-point thermoformed mask-type restraint immobilizing the head and neck and imaging was performed from the vertex to the lower edge of the clavicle. The target volumes and OAR were defined from images acquired on a Big Bore type scanner (Siemens) with a section thickness of 3 mm. The delineation of the volumes conforms to the recommendations of ICRU reports 50 and 83 [3-5] and to the international recommendations in force [6, 7]. Three PTV were defined: PTV70Gy was defined as the volume of the primary tumor site and a 3D margin of 5 mm; PTV63Gy was defined as the volume of high-risk subclinical disease plus a 3D margin of 5 mm; PTV56Gy was defined as the low-risk subclinical disease volume plus a 5mm to 7mm 3D margin. For reverse planning, target volumes were defined excluding the 3mm thick superficial area. The dose is delivered once a day, five days a week and 35 sessions boost integrated (Simultaneous Integrated Boost (SIB)) or fractions of 2 Gy on PTV70Gy, 1.8 Gy and 1.6 on the PTV63Gy on the PTV56Gy. The dose targets on PTV are that 95% of tumor volumes should receive at least 95% of the prescribed dose and 98% of tumor volumes should receive at least 90% of the prescribed dose. The aim of this work is to assess the positioning accuracy of patients on the treatment table and to describe a method for calculating systematic and random errors, in order to establish appropriate margins from CTV to PTV, taking into account the technique. Irradiation and portal imaging means available at the radiotherapy department of Cheikh Zaid International University Hospital–Rabat Morocco. The dose calculation is done by the Treatment Planning System (TPS), which creates the ballistics and calculates the dose distribution from the CT images. The TPS used is Monaco version 5.11 from the Elekta company , which is based on reverse planning its principle is to determine dose targets, whether to organs at risk or to the area to be irradiated thanks to which an algorithm (Monte Carlo) calculation will develop the best possible ballistics according to the constraints. This optimization process will make it possible to obtain modulated beams which will give a distribution as close as possible to the ideal dose distribution. The accelerator under which we carried out this study in the radiotherapy department is Elekta Infinity dedicated to make the new techniques that we have already presented; it can deliver beams of several energies in electron mode, namely 6 MeV. 9 MeV, 12 MeV, 15 MeV and 18 MeV and two in photon mode: 6 MV and 18 MV. It includes an Agility- type MLC system which has 160 blade energies of 5 mm thickness at the isocenter, making it possible to adapt and conform the shape of the beam to that of the tumor or of the area to be irradiated. Equipped with an on-board imaging system XVI for the repositioning of the patient in three dimensions, based on the isocenter and the reference scanner sections sent from the TPS [8]. The scanner used for this study is branded SIEMENS Somatom Definition AS installed in 2012, composed of 16 bars dedicated to the acquisition of three-dimensional images. It is equipped with an X-ray tube operating under five high voltage ranges: 70 kV. 80 kV. 100 kV. 120 kV and 140 kV, under an electrical supply of 80KW: the current of the tube is respectively 500 mA, 650 mA, 650 mA, 666 mA and 571 mA [9].
The 2D / 3D digital verification system optimized for rotational processing techniques. It works with user-friendly and intuitive application software. OmniPro - ImRT for a complete verification of the plan and Quality Assurance of IMRT / VMAT treatments, it consists of: 1020 Ionization chambers, Parallel reading of all ionization chambers. Stand angle sensor for easy stand setup and easy [10].
All the treatment plans present were carried out by the same operator General plans were to cover at least 95% of PTV with the prescribed prescription dose, while keeping the maximum dose below 107% of the prescribed dose level limit.
We took 528 CBCT portal images for patient positioning verification We noted in an Excel file daily the positioning errors in the three axes of space (X, Y and Z). Van Herk, [11]. Show that the PTV margin given by:
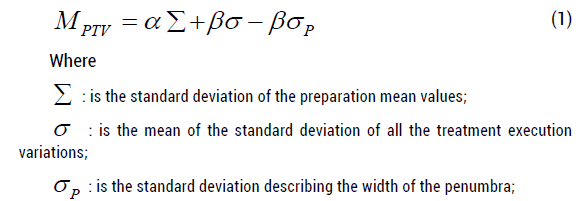
And α and β are scaling parameters depending on the required patient and CTV coverage. Assuming a certain radiation penumbra, many treatment fractions and the goal of ensuring a minimum dose of 95% to the CTV for 90% of the patients (excluding rotations and deformations), then the above equation can be simplified to:

Random errors are mainly composed of the positioning error of the patient and anatomical variations occurring between two irradiation sessions or during a session.
The impact of random errors can be simulated by blurring the dose distribution (by convolution of the dose distribution with distribution laws of the position of the organ).
For each patient; we noted all the displacements (in mm) in the directions; lateral (X), Cranio-Caudal (Y), and Anteroposterior (Z). Then we calculated the mean of the Displacements (m) of the X, Y and Z, then the Mean (M) of the Means (m). Standard Deviations (SD) or standard deviations in each axis; are also calculated.
Thus the systematic error (Σ) was estimated from the calculation of the standard deviation of the means (m) in each axis. And the random error (σ) is the square root of the mean of the sum of the SD² (RMS) (Table 1) of each axis. The following (Figure 2) is an example that shows the method of calculating these parameters:

Figure 2: Example of measured displacements (in mm) in the direction; right left; in a population of 4 patients, using portal imaging [13].
The systematic error (Σ) was estimated from the calculation of the standard deviation of the means (m) in each axis (Table 1). And the random error (σ) is the square root of the mean of the sum of the SD² (RMS) of each axis (Table 1).
Table 1. The systematic error (Σ) and the random error (σ) in each axis (cm)
| All patients | Axis (cm) | ||
| X | Y | Z | |
| Avg (means ) | 0,0388608 | 0,011045455 | 0,074318182 |
| Σ= SD of means | 0,05301205 | 0,109674838 | 0,082249639 |
| Avg (SD²) | 0,02575316 | 0,282634568 | 0,027547309 |
| σ = RMS | 0,16048 | 0,53163387 | 0,165974 |
The averages were calculated (Table 2); M = 0.27 cm
Systematic errors (1) (Σ) = SD of the means = 0.13 cm (Table 2).
Table 2. Systematic Global Error (Σ) And Random (σ) in cm, and PTV margin
| all patients | Mean ( means) | 0.27cm |
| The systematic error(Σ) | Σ = SD of means | 0.13cm |
| random error (σ) | Mean (SD²) | 0.26cm |
| σ = RMS | 0.51cm | |
| Margin PTV-CTV | Van Herk formula (mm) | 6.82 mm |
| PTV margin = 2.5 * Σ + 0.7 * σ |
Random Errors (2) (σ) = RMS = 0.51cm (Table 2)
Thus: the PTV calculated according to Van Herk's formula (Table 2) = 2.5 Σ +0.7 σ = 6.82 mm.
• The average displacement varies from -0.6 mm to 1.52 mm in the right-left direction, -2.55 mm to 2.61 mm in the craniocaudal direction and from -1.28 mm to 2.33 mm in the a direction antero-posterior (Table 3) .
• For all patients, the mean of the displacements of the isocenter (in space in all directions) varied from 1.52 mm to 7.32 mm (Table 3).
Tables 3. Min and Max values in the three axes (mm).
| All patients | X axis | Y axis | Y axis | Mean | ÃÃÃÃÂ???? Mean | Mean | Mean (R) | SD(X) | SD(Y) | SD(Z) | SD(R) |
|---|---|---|---|---|---|---|---|---|---|---|---|
| axis X | axis Y | axis Z | |||||||||
| value Min (mm) | -16 | -11,6 | -4 | -0.6 | -2.55 | -1.28 | 1.52 | 0.9 | 0.72 | 1 | 0.8 |
| value Max | 8.9 | 9.4 | 19 | 1.52 | 2.61 | 2.33 | 7.32 | 3.1 | 20.6 | 3.3 | 20 |
| (mm) |
• The standard deviation of displacements in the right-left direction; ranged from 0.9 mm to 3.1 mm, from 0.72 mm to 20.6 mm in the cranio-caudal direction and from 1.0 mm to 3.3 mm (Table 3).
• For all patients; the standard deviation of the displacements of the isocenter varied from 0.8 mm to 20 mm (Table 3).
• The values of the calculated systematic and random errors were respectively; 0.53 mm; 1.09 mm; 0.82 mm and 1.60 mm; 5.31 mm; 1.65 mm in the directions; lateral e, longitudinal and vertical (Table 4).
Tables 4. Systematic errors (Σ), random errors (σ) and the PTV-CTV margin of each axis (mm)
| X axis | Y axis | Z axis | |
|---|---|---|---|
| All patients | (mm) | (mm) | (mm) |
| ÃÂ?£ | 0.53 | 1.09 | 0.82 |
| ÃÂ? | 1.6 | 5.31 | 1.65 |
| PTV-CTV margin | 2.44 | 6.46 | 3.22 |
• The standard deviation of the means (Σ) was 1.3 mm; the root of the mean of the squared sum of the standard deviations (σ) is 5.1 mm (Table (4)). Finally our geometric concept PTV and according to Van Herk's formula (1) and (2) : 2.5 Σ + 0.7 σ PTV = (2.5x1.3) + (0.7x5.1) = 6.82 mm (Table 2).
As in most studies by authors and medical teams who calculated patient placement errors and corresponding PTV-CTV margins, we used Van Herk's formula and our results agree with those in the literature. As in most studies which calculated PTV-CTV margins, we used Van Herk's formula (1) and (2) and our results agree with those in the literature, Van Kranen et al. used anatomical data from 38 patients (8.2 CBCT / patient). They showed that the positioning uncertainties, residual after an IGRT process, could be locally quite large ranging from 1.1 mm to 3.4 mm for systematic errors and from 1.3 mm to 2.5 mm for random errors [14]. For our study, the systematic errors varied from 0.53 mm to 1.09 mm and the values of the random errors calculated were from 1.60 mm to 5.31 mm. According to Sandrine HUGER, the margins applied to the CTV volume to take into account the geometric uncertainties are quite low in their clinical practice, the margin applied for the creation of the PTV is 4 mm in the right-left and anterior-posterior direction and 5 mm in the cranio-caudal direction. These margins come from a previous study by their teams where they showed that 98% of displacements measured with portal imaging were less than 4 mm and that no displacement was greater than 5 mm [15]. Dionisi et al conducted a study where they analyzed 420 CBCT scans in 44 patients treated for head and neck cancer. The value of M was 1 mm in all directions; the values of Σ ET σ ranged over 1 mm to 1.2 mm and 1.4 mm to 1.9 mm, respectively. The PTV margins calculated according to the Van Herk formula were 3.48 mm, 4.08 mm and 4.33 mm along the 3 axes.
For our study the PTV margins are 2.44mm; 6.46 mm and 3.22 mm in the directions; lateral, longitudinal and vertical [16].
The choice of margins from PTV volume to CTV volume is crucial in the event of irradiation of nasopharyngeal tumors, as they expose to an increased risk of recurrence, and too large, they increase the risk of toxicity. This choice of margins must be based on a quantification of the displacements/deformations of the volumes of interest and the uncertainties of the irradiation techniques used. The use of CBCT imaging to measure installation errors is standard practice in many institutions. This made it possible to detect and reduce installation errors in a large number of patients. In the daily clinical routine, the PTV-CTV margins of 7 mm are safe and adoptable, however one could allow in certain particular situations such as the proximity of the organs at risk and the high dose regions, to set lower margins.
Authors declare that they have no conflict of interest. There is no source of funding.
All procedures performed in studies involving human participants were in accordance with the ethical standards of the institutional and/or national research committee and with the 1964 Helsinki declaration and its later amendments or comparable ethical standards.
The institutional review board of our institute approved this retrospective study, and the requirement to obtain informed consent was waived.
Citation: Errifai R et al. Evaluation of Setup Errors in Radiotherapy with Volumetric Intensity Modulated Arc-Therapy Based On the Cone Beam Computed Tomography for Nasopharyngeal Cancer: Case of the Cheikh Zaid Hospital. Eur J Clinic Oncol, 2022, 4(3), 30-33
Received: 27-May-2022, Manuscript No. EJCO-22-65187; Editor assigned: 30-May-2022, Pre QC No. EJCO-22-65187(PQ); Reviewed: 30-May-2022, QC No. EJCO-22-65187(Q); Revised: 03-Jun-2022, Manuscript No. EJCO-22-65187(R); Published: 10-Jun-2022, DOI: 10.35248/2376-0389.22.9.3.22.4(3) 30-33
Copyright: ©2022 Errifai R. This is an open-access article distributed under the terms of the Creative Commons Attribution License, which permits unrestricted use, distribution, and reproduction in any medium, provided the original author and source are credited.