Research Article - (2023) Volume 5, Issue 1
Electrolyte abnormalities can be life-threatening, and their management depends on the speed of onset of the electrolyte’s derangement and the patient's existing comorbidities. Electrolyte imbalances can affect the electrical activity of the heart and can be seen on an Electrocardiogram (ECG). The specific ECG changes will depend on the specific electrolyte imbalance. For example, a high potassium level (hyperkalemia) can cause tall, peaked T-waves and a widened QRS complex. Low potassium levels (hypokalemia) can cause flattened or inverted T-waves. A high calcium level (hypercalcemia) can cause a shortened QT interval and a prolonged PR interval. Low calcium levels (hypocalcemia) can cause a prolonged QT interval. A high sodium level (hypernatremia) can cause a prolonged QT interval, while a low sodium level (hyponatremia) can cause a shortened QT interval. It's important to note that electrolyte imbalances can also cause other ECG changes, such as heart rhythm disturbances, and these changes can be nonspecific, so an ECG is not the only test to confirm the electrolyte disturbance. It's also important to note that electrolyte imbalances can lead to arrhythmias, such as bradycardia, tachycardia, atrial fibrillation, and ventricular fibrillation. These arrhythmias can also be seen on an ECG.
Fibrillation • Ventricular fibrillation • Bradycardia • Electrolyte • Electrolyte imbalances
Electrolyte abnormalities
Electrolyte abnormalities can be life threatening, and their management depends on the speed of onset of the electrolyte derangement and the patient’s existing comorbidities. Electrolytes are important in many of the reactions in the human body, such as muscle contraction and conduction of action potentials, thus, their derangement can cause widespread and not always obvious clinical signs and symptoms [1]. Electrolyte imbalance is usually diagnosed in the lab, but clinical signs (such as absent reflexes or peripheral oedema) and other investigations (such as tall T waves on the ECG) may point to an underlying defect that needs to be investigated and ruled out or treated [2].
The electrocardiogram is an extremely sensitive method of detecting certain types of electrolyte imbalance. The form of the normal electrocardiogram depends on the cells normal ionic constitution and, in particular, the extracellular fluid that bathes the cardiac cells. Any signs of alteration in or the ratio between the electrolyte content of this fluid may directly or indirectly result in significant electrocardiographic changes. The electrolytes which may produce the most profound effects of the electrocardiogram when they deviate from their normal levels are calcium and potassium [3]. The important electrolytes pertaining to the electrocardiogram are potassium, calcium, and the relative concentration of these substances among themselves. Acidosis has an effect as well. Many electrolytes, such as sodium and magnesium, known to alter the ECG in experimental animals, do not produce changes in man because they do not reach low concentration levels [4].
ECG changes due to electrolyte imbalance (electrolyte disorder)
The normal cardiac action potential may be altered by electrolyte imbalance owing to changes in intra and extracellular electrolyte concentrations. Because myocyte depolarization and repolarization depend on intra and extracellular shifts in ion gradients, abnormal serum electrolyte levels can have profound effects on cardiac conduction and the electrocardiogram EKG [5]. Changes in extracellular potassium, calcium, and magnesium levels can change myocyte membrane potential gradients and alter the cardiac action potential. These changes can result in incidental findings on the 12- lead EKG or may precipitate potentially life threatening dysrhythmias [6]. The EKG may be used to estimate the severity of electrolyte imbalances and to assess the risk of severe arrhythmias. This is possible because a correlation exists between the severity of the electrolyte imbalance and the changes visible to the EKG.
Electrophysiology of the heart
Depolarization: The electrical charge of a cell is altered by a shift of electrolytes on either side of the cell membrane. This change stimulates muscle fibers to contract.
Repolarization: Chemical pumps re-establish an internal negative charge as the cells return to their resting state.
The normal state of cardiac cell membrane polarization depends upon maintaining a normal ionic balance across the membranes, with K+ being the most important. Because changes in intracellular K+ concentration are proportionately much smaller than changes in extracellular K+ concentration, it follows that the absolute level of extracellular K+ concentration is the single most important factor affecting the cell membranes (Figure 1) [7].
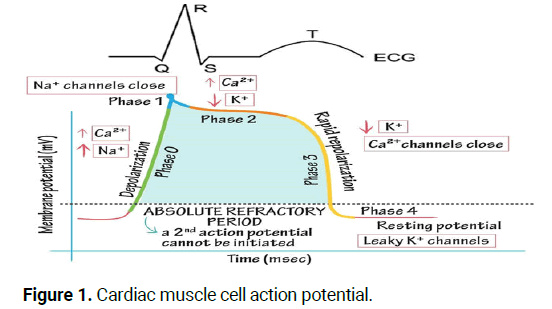
Figure 1: Cardiac muscle cell action potential.
Cardiac muscle cell action potential
Phase 0: Rapid depolarization phase.
• Sodium (Na+) rapidly into the cell.
• Calcium (Ca++) slowly into the cell.
Phase 1: Early repolarization phase, sodium (Na+) channels closed.
Phase 2: Plateau phase.
• Potassium (K+) rapidly out of the cell.
• Calcium (Ca++) slowly into the cell.
Phase 3: Rapid repolarization phase, calcium (Ca++) channels closed.
• Potassium and sodium ion positions are reversed.
• Potassium (K+) rapidly out of the cell.
Phase 4: Resting potential phase, the cell membrane is impermeable to Na+, and K+ moves out of the cell [8].
Specific electrolyte disorders
Sodium (Na+): Increased (hypernatraemia) and decreased (hyponatremia) sodium levels do not have any effect on the ECG, nor cardiac rhythm or impulse conduction (Non-significant changes on the ECG) [9].
Calcium (Ca++): Changes in extracellular calcium concentration have a profound effect on the duration of the plateau (phase 2) of the action potential. The duration of the plateau increases at low extracellular calcium concentrations and shortens at high calcium concentrations [10-15].
Hypercalcemia or high calcium level: Is a common metabolic emergency that occurs when serum calcium is elevated above the normal range.
• Normal serum corrected calcium=2.1-2.6 mmol/L.
• Mild hypercalcaemia=2.7-2.9 mmol/L.
• Moderate hypercalcaemia=3.0-3.4 mmol/L.
• Severe hypercalcaemia=greater than 3.4 mmol/L.
Etiology: Primary hyperparathyroidism and malignancies cause 90% of all cases of hypercalcaemia. Less common causes are Prolong immobilization, sarcoidosis, thyrotoxicosis, familial hypocalciuric hypercalcaemia, Addison’s disease, renal failure, tamoxifen, lithium, thiazide diuretics, D vitamin and excessive intake of calcium supplements [16-19].
Clinical manifestations
Gastrointestinal: Anorexia, nausea and vomiting, constipation and abdominal pain.
Neuromuscular:
• Mild to moderate hypercalcemia state: Weakness, tiredness, or
muscle pain.
• Severe hypercalcemic: Extreme lethargy, confusion,
disorientation.
Cardiovascular: Dysrhythmias
Musculoskeletal: Bone pain, fracture.
ECG changes due to hypercalcemia:
• The main change is the shortening in the Q-T interval on the ECG.
The T wave duration is unaffected, but the ST segment duration
is shortened. Patients with hypercalcemia have an increased
sensitivity to digitalis and may present with various arrhythmias.
• In severe hypercalcemia, Osborn waves (J waves) may be seen.
• Ventricular irritability and VF arrest have been reported in severe
hypercalcemia (Figures 2 and 3).
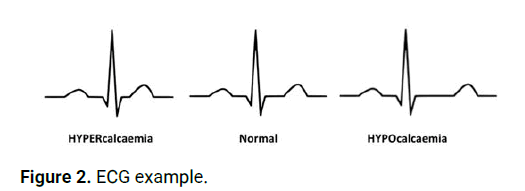
Figure 2: ECG example.
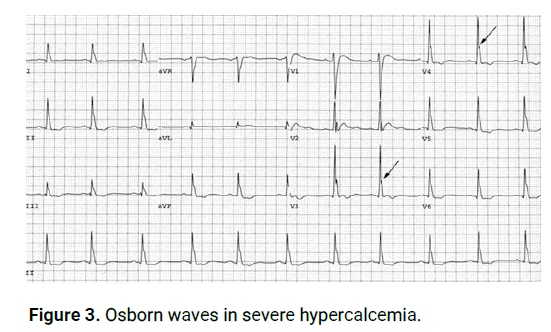
Figure 3: Osborn waves in severe hypercalcemia.
The interval between the onset of QRS and the onset of the T wave (Q-oT) became shorter at higher calcium levels, although the T wave was pro- longed, and the QT interval became more normal.
Hypercalcemia usually does not alter the P and T waves' morphology, but a slight, statistically significant increase in T wave duration was reported.
Nursing interventions
• Monitor cardiovascular, respiratory, neuromuscular, renal,
and gastrointestinal status; place the client on a cardiac monitor.
• Discontinue IV infusions of solutions containing calcium and
oral medications containing calcium or vitamin D.
• Discontinue thiazide diuretics and replace them with
diuretics that enhance the excretion of calcium.
• Administer medications as prescribed that inhibit calcium
resorption from the bone, such as phosphorus, calcitonin,
bisphosphonates, and prostaglandin synthesis inhibitors
(aspirin, nonsteroidal anti-inflammatory drugs).
• Prepare the client with severe hypercalcemia for dialysis if
medications fail to reduce the serum calcium level.
• Instruct the client to avoid foods high in calcium.
Hypocalcemia or low calcium level: Occurs when calcium levels fall below the normal range.
• Normal serum corrected calcium=2.2-2.6 mmol/L.
• Mild-moderate hypocalcaemia=1.9-2.2 mmol/L.
• Severe hypocalcaemia =<1.9 mmol/L.
Etiology: Acute pancreatitis, pancreas surgery, alkalosis (hyperventilation), rhabdomyolysis, septicemia (sepsis), osteolytic cancer metastases, abnormal calcium absorption (gastrointestinal) and resorption (from primary urine), renal failure, small bowel syndrome, parathyroid gland surgery, use of bisphosphonates, excess calcitonin, use of phenytoin, use of phosphate substitution.
Clinical manifestations
Neuromuscular: Tetany symptoms: Twitching around the mouth, tingling and numbness of fingers, facial spasm, convulsions.
Respiratory: Dyspnea, laryngeal spasm. Gastrointestinal: increased peristalsis, diarrhea. Cardiovascular: Dysrhythmias, palpitations (Figure 4).
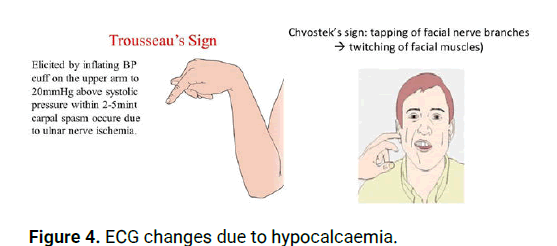
Figure 4: ECG changes due to hypocalcaemia.
ECG changes due to hypocalcaemia
The main ECG change is prolongation of the Q-T interval. There is no unchanged in T wave duration, but the ST segment is prolonged.
• Hypocalcaemia causes QTc prolongation primarily
byprolonging the ST segment.
• Dysrhythmias are uncommon, although atrial fibrillation has
been reported.
• Torsades de pointes may occur but is much less common
than with hypokalemia or hypomagnesaemia (Figure 5).
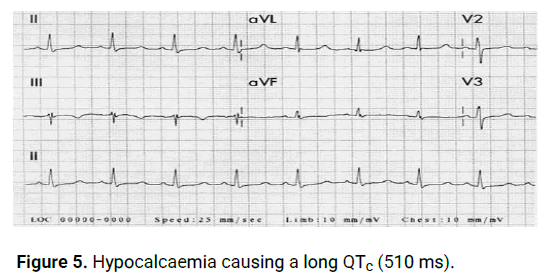
Figure 5: Hypocalcaemia causing a long QTc (510 ms).
The duration of the ST segment is inversely related to the plasma calcium concentration. Usually, lengthening of the ST segment, Q-aT, and the QT interval are the only ECG abnormalities; but the QTc interval seldom exceeds 140 percent of normal.
Nursing interventions
• Monitor cardiovascular, respiratory, neuromuscular, and
gastrointestinal status; place the client on a cardiac monitor.
• Administer calcium supplements orally or calcium intravenously.
• When administering calcium intravenously, warms the injection
solution to body temperature before administration and
administer slowly, monitor for electrocardiographic changes, and
monitor for hypercalcemia.
• Administer medications that increase calcium absorption i.e.
Vitamin D aids in the absorption of calcium from the intestinal
tract.
• Initiate seizure precautions.
• Keep 10% calcium gluconate available for the treatment of acute
calcium deficit.
• Instruct the client to consume foods high in calcium.
Potassium (K+): Potassium plays a key role in both depolarization andrepolarization, which is why potassium imbalance may cause dramatic ECG changes. These are of utmost clinical significance. There is a rather strong correlation between plasma potassium level and ECG changes, and the risk of arrhythmia. Therefore, the ECG may be used to estimate the severity of hyperkalemia.
Hyperkalaemia: is a common cause of electrolyte-induced cardiac conduction disturbance. A well-defined series of changes at the cellular level leads to characteristic evolutionary changes in the surface electrocardiogram. Initial high T waves and shortened intervals give way to prolongation of conduction and lethal dysrhythmias as the serum potassium level rises.
• Hyperkalaemia is defined as a potassium level>5.5 mEq/L.
• Moderate hyperkalaemia is a serum potassium>6.0 mEq/L.
• Severe hyperkalaemia is serum potassium>7.0 mE/L
Etiology: Severe hyperkalemia is usually the result of several interacting factors, such as renal failure, insufficient corticosteroid substitution, acidosis, hemolysis and massive muscle damage. Potassium substitution may be the etiology. Potassium sparing diuretics, ACE inhibitors and Angiotensin Receptor Blockers (ARBs) may also cause hyperkalaemia. Insulin deficiency, Addison’s disease and digoxin intoxication may also cause hyperkalemia.
Clinical manifestations
Skeletal muscle weakness/paralysis
Heart block Effects of hyperkalaemia on the ECG: All of the ECG changes that occur with a raised K+ concentration are nonspecific and may affect any part of the ECG. Hyperkalemia has been shown to depress the atria, the A-V node, and the ventricles but has less effect on the sinus nodes.
The typical progressive changes of hyperkalaemia are as follows:
• The appearance of tall, pointed, narrow T waves.
• Decreased P wave amplitude decreased R wave height,
widening of QRS complexes, ST segment changes (elevation/
depression), Hemi block (esp. left anterior) and 1st degree heart
block.
• Advanced intraventricular block (very wide QRS with RBBB,
LBBB, and bi- or tri-fascicular blocks) and ventricular ectopic.
• Absent P waves, very broad, bizarre QRS complexes, AV block,
VT, VF or ventricular asystole (Figure 6).
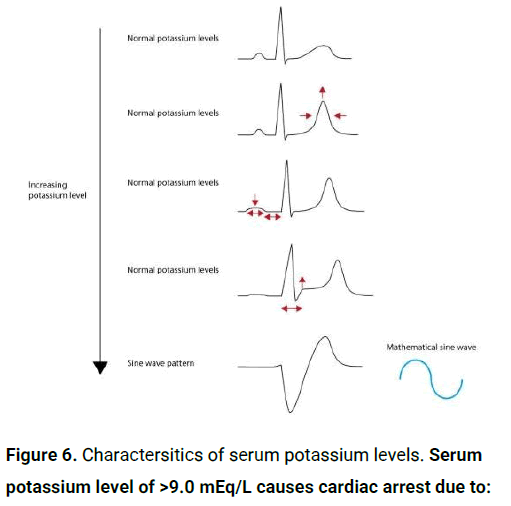
Figure 6: Charactersitics of serum potassium levels. Serum potassium level of >9.0 mEq/L causes cardiac arrest due to:
• Asystole.
• Ventricular fibrillation.
• PEA with bizarre, wide complex rhythm (Figure 7).
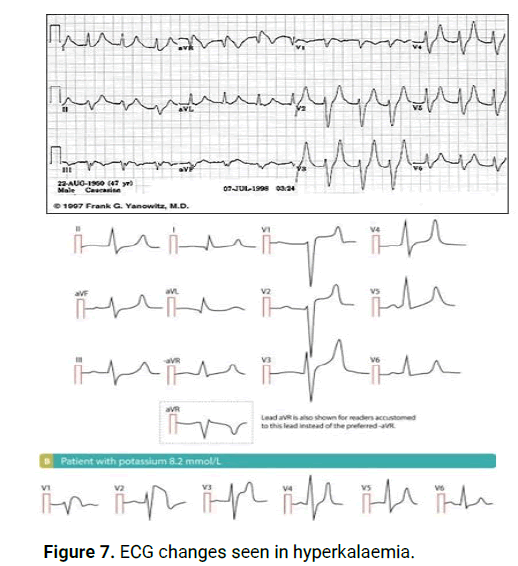
Figure 7: ECG changes seen in hyperkalaemia.
Nursing interventions
• Monitor cardiovascular, respiratory, neuromuscular, renal, and
gastrointestinal status; place the client on a cardiac monitor.
• Prepare to administer potassium-excreting diuretics if renal
function is not impaired.
• If renal function is impaired, prepare to administer sodium
polystyrene sulfonate (Kayexalate).
• Prepare the client for dialysis if potassium levels are critically
high.
• Prepare for the IV administration of hypertonic glucose with
regular insulin to move excess potassium into the cells.
Dietary management
• When hyperkalemia is severe, immediate actions are needed
to be taken to avoid severe cardiac disturbances.
• The administrations of foods that are low in potassium help
correct the problem and prevent further potassium excess.
Hypokalaemia: the serum potassium level drops below 3.5 mEq/ L. In moderate.
• Hypokalaemia is defined as a potassium level <3.5 mmol/L.
• Moderate hypokalaemia is a serum level of <3.0 mmol/L.
• Severe hypokalaemia is defined as a level <2.5 mmol/L.
Etiology: Diarrhea, excess vomiting, alcoholism, malnutrition, acute medical illness, primary or secondary aldosteronism, excess intake of licorice, glucose infusion, diuretics, adrenergic agonists, corticosteroids, insulin.
Clinical manifestations
Neuromuscular: Muscle aches and stiffness, smooth muscle, cramps and spasms.
Digestive problems: Constipation/ileus
Mood changes
Skeletal muscle: Weakness and fatigue.
Heart palpitations
Effects of hypokalemia on the ECG: ECG changes in decreasing order of frequency are: ECG changes when K+ <2.7 mmol/l.
• Prolongation of the QRS duration increased P wave amplitude
and duration.
• Prominent U waves (best seen in the precordial leads).
• Apparent long QT interval due to a fusion of the T and U waves
(=long QU interval).
• ST segment depression decreased T wave amplitude. With
worsening hypokalaemia.
• Frequent supraventricular, ventricular ectopic and heart blocks.
• Supraventricular tachyarrhythmia: AF, atrial flutter, atrial
tachycardia.
• Potential to develop life-threatening ventricular arrhythmias,e.g.
VT, VF and torsade’s de pointes (Figures 8-10).
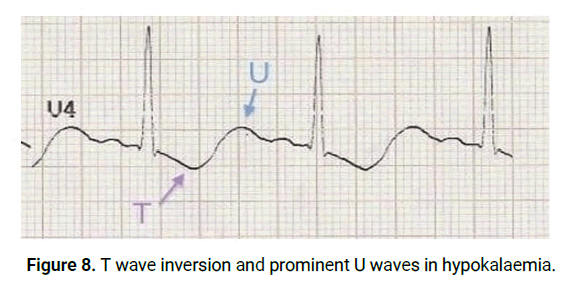
Figure 8: T wave inversion and prominent U waves in hypokalaemia.
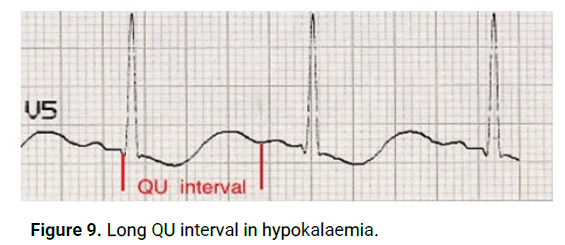
Figure 9: Long QU interval in hypokalaemia.
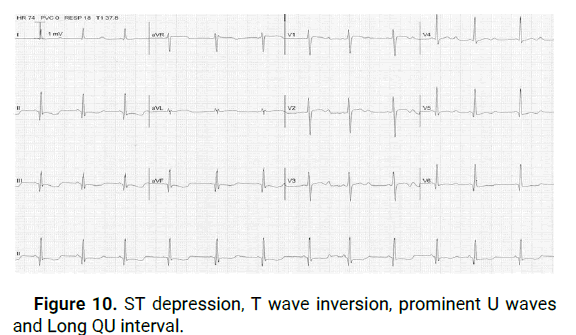
Figure 10: ST depression, T wave inversion, prominent U waves and Long QU interval.
Hypokalaemia may cause acquired Long QT Syndrome (LQTS) and predisposes to torsade de Pointes (polymorphic ventricular tachycardia). Hypokalaemia may also cause monomorphic ventricular tachycardia. Hypokalaemia potentiates the proarrhythmic effects of digoxin.
Nursing interventions
• Determining and correcting the cause of the imbalance.
• Extreme hypokalemia requires cardiac monitoring.
• The administrations of foods that are high in potassium help
correct the problem and prevent further potassium losses.
Pharmacological management
• Oral potassium replacement therapy is usually prescribed for
mild hypokalemia.
• Potassium is extremely irritating to gastric mucosa; therefore,
the drug must be taken with a glass of water or juice or during
meals.
• Potassium chloride can be administered intravenously for
moderate or severe hypokalemia and must be diluted in IV fluids.
Magnesium: After potassium, magnesium is the most abundant cation (positively charged ion) in intracellular fluid and performs many important bodily functions. For example, it promotes enzyme reactions within the cell during carbohydrate metabolism.
• The normal range for blood magnesium level is 1.7 mg/dL to 2.2 mg/dL.
Hypermagnesaemia is rare, but severe hypermagnesaemia may cause atrioventricular and intraventricular conduction disturbances, which may culminate in third degree AV block or asystole.
Hypomagnaesemia may potentiate the pro-arrhythmic effect of digoxin. Hypomagnasemia may also predispose to supraventricular and ventricular tachyarrhythmias.
Hypomagnesemia is defined as a serum magnesium level of less than 1.7 mg/dL.
Causes of hypomagnesemia
• Diarrhea, vomiting.
• Chronic alcoholism.
• Prolonged malnutrition.
• Impaired GI absorption.
• Poorly controlled DM.
Clinical manifestations
• Myocardial irritability
• Anorexia, nausea
• Abdominal distension
• Severe cases: Chvostek’s and trousseau’s sign, tetany,
convulsions, stroke.
Nursing interventions
• Oral magnesium replacement (antacids).
• Parenteral magnesium sulphate.
• Increase dietary intake of magnesium (chilli, tofu, wheat gram).
• Initiate safety and seizure precautions in severe cases and
monitor all electrolytes.
• Keep watch on rising magnesium levels.
Hypermagnesemia is defined as a serum magnesium level >3 mg/dL
• Causes of hypermagnesemia
• Renal insufficiency.
• Excessive antacid use.
• Adrenal insufficiency.
• Ketoacidosis.
Clinical manifestations: Are related to the blocked release of acetylcholine from the myoneronal junction, which affects muscle cell activity.
• Hypotension.
• Muscle weakness.
• Prolonged QT, PR interval.
• Lethargy, drowsiness.
• Respiratory paralysis, loss of consciousness.
Nursing interventions
• Low magnesium diet (eat chicken, eggs, green peas, white
bread, hamburger).
• Decrease magnesium sulphate use.
• In severe cases, saline infusion with diuretics is given to
promote magnesium excretion.
• IV calcium (antagonistic action).
• If renal failure is also present, then hemodialysis is done in
severe cases.
In hypomagnesaemia, there is flattening of the T waves, ST segment depression, prominent U waves and, occasionally, a prolonged P-R interval occurs. In hypermagnesaemia, there may be a prolonged P-R interval and widened QRS complexes.
• ECG changes of hypomagnesaemia resemble that of
hypokalaemia.
• ECG changes of hypermagnesaemia resemble that of
hyperkalaemia.
• Hypokalaemia, hypomagnesaemia and hypercalcaemia
aggravate digitalis toxicity.
This case illustrates an interesting example of how multiple electrolyte abnormalities may modify various components of the ECG. The result in this case was an interesting combination of effects including peaked T waves, prominent U waves, and an unusual prolongation of the segment following the U wave (“teepee” sign). This appearance was attributed to a significant electrolyte disturbance consisting of concurrent hyperkalemia, hypocalcemia, and hypomagnesemia. Early recognition of this sign may contribute to rapid correction of electrolyte imbalance, preventing potential serious complications.
[Crossref] [Google Scholar] [PubMed]
[Crossref] [Google Scholar] [PubMed]
[Crossref] [Google Scholar] [PubMed]
[Crossref] [Google Scholar] [PubMed]
[Crossref] [Google Scholar] [PubMed]
[Crossref] [Google Scholar] [PubMed]
[Crossref] [Google Scholar] [PubMed]
[Crossref] [Google Scholar] [PubMed]
Citation: Alkhaqani A. "Electrocardiography Morphology of Electrolytes Disturbance". J Clin Nurs, 2023, 5(1), 1-6.
Received: 03-Jun-2023, Manuscript No. JCNP-23-101137; Editor assigned: 06-Jun-2023, Pre QC No. JCNP-23-101137 (PQ); Reviewed: 20-Jun-2023, QC No. JCNP-23-101137; Revised: 03-Aug-2023, Manuscript No. JCNP-23-101137 (R); Published: 10-Aug-2023, DOI: 10.35248/JCNP.23.5(1).001
Copyright: © 2023 Alkhaqani A. This is an open-access article distributed under the terms of the Creative Commons Attribution License, which permits unrestricted use, distribution, and reproduction in any medium, provided the original author and source are credited.