Research Article - (2025) Volume 14, Issue 1
In this paper, we investigate the postulation for cost reduction and competitive advantage in the pharmaceutical companies by analysing the research and development cost in those companies, where we predict this cost to be low if such postulations are applied. We use a discriminant analysis model with linear discriminant function to predict how pharmaceutical companies will prefer their cost of research and development. Our results and analysis predict that pharmaceutical companies will prefer high research and development cost for the multiple areas of new drugs and diseases rather than low cost, and the choice is more obvious in the areas for antineoplastic drugs (cancer diseases), alimentary tract and metabolism (digestive diseases), sensory organs drugs (eyes, ears, nose, or tongue diseases), dermatologics (skin diseases), and antiinfectives (infectious diseases). We recommend future research to replicate and assure our results.
Research and development cost • Cost reduction • Competitive advantages • Pharmaceutical new projects
Pharmaceutical companies all over the world provide the market with drugs that have become expensive to treat various diseases, whether known or still understudy and research. Those companies face the challenges of managing the risk resulted from their strategies related to developing the value chain of producing the drugs, and due to the increased demand for a highly engineered innovative formulations, and in the meantime avoid undesired events throughout the value chain of the production, for the purpose of creating their comparative advantages in the market, and in my view, understating the strategy of cost reduction [1].
In this essence, the research and development cost that pharmaceutical companies incur is the reason for successful approval and lunch of new drugs. Therefore, the cost accounting strategies are very significant in this context, where strategies like the activity-based costing can help reduce the research and development cost, by focusing on avoiding activities of non-value added, and, in the meantime increasing the innovation potential, like using the nanotechnology to the delivery of pharmaceutical to reduce undesired toxicity. Additionally, increasing the use of costefficient outsourcing.
Nevertheless, the market is witnessing high prices of the drugs, particularly those drugs used for treating the new complex diseases, as a result of the high research and development cost, and the high cost structure of producing those drugs. Where such costs have become difficult to control, and are affected by the instability of the economic circumstances and the risk of high inflation rates, as well as the complexity of the pharmaceutical experiments and the new methods of innovation used to produce those drugs.
On the other hand, pharmaceutical companies are facing the challenge of managing to develop strategies for opportunity costs, quality assurance, and breakthrough innovation investments, when the risk of competition for producing new drugs is evolving, as a result of the rise in the research and development cost among the top leading pharmaceutical companies like Novartis, Roche, Johnson and Johnson, and Pfizer [2].
Moreover, accounting for the research and development cost is controversial due to the need to technically distinct between expensing it or capitalizing it, where the generally accepted accounting principles GAAP require to expense it, and the international financial reporting standards IFRS require to expense it and capitalize it if technically classified as capital developing expenditure. Therefore, the comparison among pharmaceutical companies is controversial, and makes the competition high in the market in regard to the drug prices.
To that extent, the role of pharmaceutical regulatory affairs extends to more than drug production, to include the marketing, the post marketing tactics, the quality, and more, in order to evaluate and review the dossier. Subsequently, pharmaceutical companies tend to use the techniques of machine learning and artificial intelligence in order to provide a high-quality drug, and to bring to the industry the efficiencies of the research and development cost [3].
Nevertheless, diversifications to the research and development cost and new projects with other companies and countries, may reduce such cost, but the market has never shown this reduction, where drug prices are continuously inflated. Therefore, pharmaceutical companies should try to develop the strategies of cost reduction, and obtaining a competitive advantage in the market by working on developing techniques for reducing the research and development cost, and estimates it for the purpose of parametric cost analysis, particularly in periods of uncertainty and economic fluctuations.
In this paper, we investigate whether the importance of reducing the cost of research and development and creating a competitive advantage is favourable to the pharmaceutical companies over the innovation expansion, and the implementations of strategies that lead to high research and development cost of producing the new drugs needed for various areas of diseases’ treatments. Therefore, our research question is raised as: “Will pharmaceutical companies prefer low research and development cost or high research and development cost to produce new drugs for various areas of diseases? Where the low cost relatively warrants the adoption of the postulated strategies of cost reduction and creating a competitive advantage [4].
As a consequence, we use a discriminant analysis model to investigate this matter and help answer the paper’s question. Accordingly, the hypothesis of this paper H1 is “pharmaceutical companies prefer low research and development costs to adopt the postulated strategies of cost reduction and creating a competitive advantage”.
The remaining of this paper is organized as follow: Section II discusses the research design, and section III analyses the results, and finally section IV presents the summary discussion and concluding remarks.
Data and the model
Data used for this paper are presented to show the rising prices of new drugs used for the treatment of diseases in various areas of pharmaceutical. In Figure 1, we present firstly the data area graph of the rising estimated costs of the antineoplastic drugs used for the treatment of lung, tracheal, and bronchus cancer, as an implicit evidence for the estimated high research and development cost of producing the drugs [5].

Figure 1:Area graph of the rising estimated costs of the antineoplastic drugs.
Secondly, we use the data shown in the study published by the American medical association for “estimated research and development investment needed to bring a new medicine to the market, 2009-2018” written by Olivier J. Wouters, Martin McKee and Jeroen Luyten, where data are available from the search in the USA securities and exchange commission SCE, the 10-K and 10-Q forms for those firms presenting their research and development data for the pharmaceutical product.
Table 1 shows the data we prepared and presented for the need for this study in order to run a discriminant analysis model, as to examine this paper’s hypothesis. The table presents the number of pharmaceutical companies that we classified into two groups (A and B) based on the cost of research and development incurred by those companies, which indicate their tendency to choose the strategies of low research and development cost or high research and development cost for the new areas of diseases in the field of pharmaceutical research [6].
| Area number | Name of the disease’s new project (*) | Number of pharmaceutical companies preferring low and medium or high estimated research and development cost | Estimated research and development cost |
|---|---|---|---|
| Group (A) pharmaceutical companies tending to low and medium estimated research and development cost. | |||
| 1 | Blood and blood-forming organs | 2 | $793,000 |
| 2 | Musculoskeletal system | 2 | 937,000,000 |
| 3 | Nervous system | 8 | 1,076,000,000 |
| 4 | Hyperkalemia and hyperphosphatemia | 1 | 1,121,000,000 |
| 5 | Cardiovascular system | 3 | 1,152,000,000 |
| Group (B) t pharmaceutical companies tending to high estimated research and development costs. | |||
| 6 | Anti-infectives for systemic use | 5 | $1,259,000,000 |
| 7 | Sensory organs | 2 | 1,302,000,000 |
| 8 | Alimentary tract and metabolism | 15 | 1,430,000,000 |
| 9 | Dermatologicals | 4 | 1,998,000,000 |
| 10 | Antineoplastic and immunomodulating agents | 20 | 4,461,000,000 |
| Note: (*) Areas of diseases Blood and blood-forming organs=Area of blood and bone marrow diseases Musculoskeletal system drugs=Area for bones and muscles diseases Nervous system drugs=Area for nervous system diseases Hyperkalemia and hyperphosphatemia=Area for kidneys diseases Cardiovascular system drugs=Area for heart and blood vessels diseases Anti-infectives=Areas for infectious diseases Sensory organs drugs=Area for eyes, ears, nose, or tongue diseases Alimentary tract and metabolism=Areas for digestive diseases Dermatologics=Areas for skin diseases Antineoplastic drugs=Ares for cancer diseases |
|||
Table 1. Data classified for the study and for running the discriminant analysis model.
The time period of these data is for the last period from year 2008 till 2018 and can be active till 2023 as well. For the model of discriminant analysis, we assign 1 for the areas of disease that pharmaceutical companies choose for it the strategy of low research and development cost, and 0 for the strategy of high research and development cost. And we assign 1 for the areas of disease that pharmaceutical companies choose for it the strategy of high research and development cost, and 0 for the strategy of low research and development cost.
Using the MINITAB statistical package, we record the data to a discriminant analysis model, and run the model which is appropriate to answer the paper’s question, and tests the hypothesis as well, in order to predict whether pharmaceutical companies will prefer the postulation of cost reduction and competitive advantages or the highly engineered innovative formulations that lead to high research and development cost [7].
The model
The discriminant analysis model we design and can help answer the research question requires testing the hypothesis. Thus, we construct a multiple discriminant model taking into account all the statistical assumptions for running this following model and for identifying the discriminant function as follows:
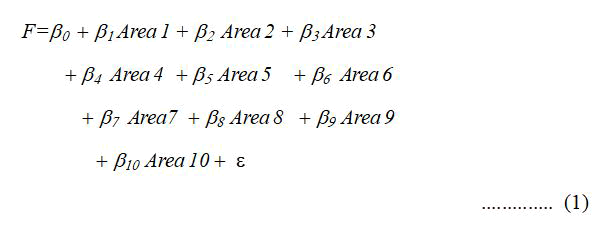
Where:
F=Pharmaceutical companies’ preferences for research and development cost for new areas of diseases, divided into group A and group B (20 preferences in each group).
Area 1=Blood and blood-forming organs (Area for blood and bone marrow diseases).
Area 2=Musculoskeletal system drugs (Area for bones and muscles diseases).
Area 3=Nervous system drugs (Area for nervous system diseases). Area 4=Hyperkalemia and hyperphosphatemia (Area for kidneys diseases).
Area 5=Cardiovascular system drugs (Area for heart and blood vessels diseases).
Area 6=Anti-infectives (Area for infectious diseases).
Area 7=Sensory organs drugs (Area for eyes, ears, nose, or tongue diseases).
Area 8=Alimentary tract and metabolism (Area for digestive diseases).
Area 9=Dermatologics (Area for skin diseases).
Area 10=Antineoplastic drugs (Area for cancer diseases).
To significantly measure the association of any of the 10 areas of new drugs and diseases with the pharmaceutical companies’ choice of low or high research and development cost, subsequently with the postulation of cost reduction strategies and the competitive advantage, the dependent variable (expressed as latent variable in the linear discriminant analysis) represents the 20 preferences of the pharmaceutical companies, divided into two groups A and B, as it is expected that this 20 preferences are not all tending to be the same [8].
On the other hand, independent variables are expected to significantly help predict and assure the separation of the 20 preferences for each pharmaceutical company into two different groups, and help identify the most influencing preference, which will contribute to the separation.
Table 2 displays information about descriptive statistics, which are significant for measuring the differences among the preferences in group A and B of the 20 preferences of the pharmaceutical companies, for the reason of making sure that there are significant group differences, otherwise we have to take into account for this paper’s question and hypothesis other views and matters.
To that extent , descriptive statistics indicate variations between group A and group B, as there is strong difference between the means of group A and group B, 0.0800 versus 0.2300 respectively, and the standard error of the mean is slightly different between group A and group B, as the difference=0.010 , which represents the accuracy of both samples in group A and group B as to conduct the analysis, also the variance=0.0740 versus 0.1780 for group A and group B respectively, which is significantly low, indicating the accuracy of the data as well [9].
| Under study groups(a) | Mean | SE Mean | St. Dev. | Variance |
|---|---|---|---|---|
| Group A of first 20 pharmaceutical companies’ preferences for low research and development cost to each area | 0.08 | 0.0192 | 0.272 | 0.074 |
| Group B of first 20 pharmaceutical companies’ preferences for high research and development cost to each area | 0.23 | 0.0298 | 0.4219 | 0.178 |
| Note: (a)General linear model for analysis of variance: Group A adjusted mean square-Adj MS=0.38234 for the preference of low research and development cost Group B adjusted mean square-Adj MS=0.9200 for the preference of high research and development cost Adjusted Mean square Adj MD-represents the variation between the sample means. As a result: Group A and B are significantly different, thus we use the discriminant analysis to test the hypothesis H1 (pharmaceutical companies prefer low research and development costs to adopt the postulated strategies of cost reduction and creating a competitive advantage). |
||||
Table 2. Descriptive statistics for the data in the discriminant analysis model (n=200).
Regarding the variation between group A and group B, the standard deviation shows a difference between both groups and equals approximately 0.15, where the standard deviation for group A is lower than it is for group B and equals 0.2720 versus 0.4219 respectively, suggesting and assuring the separation of group A and B, and subsequently the variance of group A and group B is significantly different as well, confirming the separations of the two groups.
In sum, descriptive statistics predict a group membership for A and B, suggesting the separation due to the indications that show a significant difference. As a result, the initial analysis shown by the descriptive statistics promote the usage of discriminant analysis to measure how the 10 areas of new drugs and diseases (as independent variables) contribute to the separation of group A and group B for the 20 preferences of the pharmaceutical companies research and development cost, and in the meantime show what preferences are heavily considered by the pharmaceutical companies in practice [10].
Discriminant analysis results
To investigate the differences shown by descriptive statistics between group A and B, the discriminant analysis drives the equation 1 as a linear combination of the 20 preferences for the low or large research and development cost, that will discriminate best between the two groups, for the purpose of generating the discriminant function. Table 3 reports the results of running equation 1 using the MINITAB statistical package, as to result in the primarily investigations of the discriminant function, which is the first step for the discriminant analysis.
From Table 3, panel A shows the summary of classification, as to identify the probabilities of classifying an area of new drug and disease put into a group, whereas the discriminant analysis mainly and correctly identified N correct=47 preferences of pharmaceutical companies from total N=200 preferences, and the probabilities of classifying at least one of the areas (the 10 independent variables) are listed in a descending order for group A, and for group B.
As a result, the highest probability is identified for the Area 10 by 1.000, followed by area 4 by the probability of 0.950, and for the last area, it is identified for the area 3 by the probability of 0.400 as the lowest.
| Panel A: Summary of classification | |||
|---|---|---|---|
| Put into group (Independent variables) | True group (a)Probabilities of classifying an area of a new drug and disease in the group | ||
| Area 10 | 1 | ||
| Area 4 | 0.95 | ||
| Area 3 | 0.4 | ||
| (a)N=200 N correct=47 Proportion (Probability) correct=0.235, Area 1, 2, 5, 6, 7, 8, 9 are dropped because they have a zero probability. | |||
| Panel B: Linear discriminant function for groups (equation 1) | |||
| Group A | Group B | ||
| Put into group (Independent variables) | (b)Linear discriminant function | Put into group (Independent variables) | (c)Linear discriminant function |
| Area 3 | 6.387 | Area 10 | 15.2 |
| Area 5 | 2.395 | Area 8 | 11.4 |
| Area 1 | 1.597 | Area 6 | 3.8 |
| Area 2 | 1.597 | Area 9 | 3.04 |
| Area 4 | 0.798 | Area 7 | 1.52 |
| Note: (a)Latent variable F represents the LDF (linear discriminant function). (b and c)The descending order for discriminant function, from MINITAB results, as the group with the smallest squared distance are shown in the appendix, Table A (1). |
|||
Table 3. Primarily investigations of discriminant function.
As a consequence, the interpretation for the identified probabilities means that the primarily investigation predicts that the preferences of research and development costs to contribute to the separation of the group of preferences into A and B are initially identified by the area 10, because of the noticeable importance for the heavily needed Antineoplastic drugs to the treatment of cancer diseases.
Also the separation is identified by area 4, (which indicates the heavily need for hyperkalemia and hyperphosphatemia for the treatment of kidney diseases), where the treatment of kidney diseases that lead to the kidneys’ failure are under continuous studies in the medicine literature.
Moreover, the separation is identified by area 3 of Nervous system drugs for the treatment of nervous system diseases, because this area of humans’ nervous system is very important to study in the medicine literature due the pressures people face in their life in recent time, and due to people’s duties which race the time and escape the social life somehow.
In panel B, we run the equation 1 for the linear discrimination function for the two groups A and B using the MINITAB. Subsequently, the results show the linear discrimination function F for all the areas (independents variables) in a descending order for each group. Using our visual analysis, it is obvious how the discriminant functions’ list of group B has more Fs greater than group A, which initially indicate that the separation of group B is due to the prediction of equation to the preferences of pharmaceutical companies, that will contribute to the separation of this group B from group A [11].
As a result, group B is significantly affected by pharmaceutical companies’ choice for the preference of high research and development cost more than group A. For group B, these areas (in a descending order) are: Area 10 on top of the list with F=15.200, followed by area 8 with F=11.400, then area 6 with F=3.800, and Area 9 with F=3.040, and finally area 7 with F=1.520. This list reports the most influencing areas of new drugs and diseases that are expected to contribute to separation of the preferences of either low cost of research and development or high cost of research and development.
Nevertheless, for more assurance and accurate results and decision analysis, Table 4 shows the last step for the linear discriminant analysis, which is the summary of misclassified observations. It is obvious that the most influencing areas of new drugs and diseases (independent variable) to put into group B and contributes to the separation of the preferences are the area 10, followed by area 8, Area 7, area 9, and area 6, with posterior probabilities equal 0.607, 0.377, 0.148, 0.118, and 0.100 respectively.
On the other hand, all the independent variables of group A as: Area 1, area 2, area 3, area 4, and area 5 with their posterior probabilities of:(0.148 with higher squared distance than group B , 0.148 with higher squared distance than group B , 0.045, 0.157, 0.134 and skipped as it is slightly lower than group B) are not classified for any significant posterior probability compared to group B, as a result for the pharmaceutical companies tendency to choose the low research and development cost for the new drugs and diseases, and most of other companies in our study prefer to choose the high research and development costs, which seemingly the reason why the new drugs for the complex diseases are so expensive in the international markets.
In sum, the most significant areas of new drugs and diseases to contribute to the separation of group B from group A of the preferences of the pharmaceutical companies to low or high research and development cost for new drugs and diseases are, in order, area 10 for antineoplastic drugs (area for cancer diseases), area 8 for alimentary tract and metabolism (area for digestive diseases), Area 7 for sensory organs drugs (area for eyes, ears, nose, or tongue diseases), area 9 for dermatologics (area for skin diseases), and Area 6 for anti-infectives (areas for infectious diseases).
| Put into group B(a) (Equation 2) | ||
|---|---|---|
| (Independent variables) | Squared distance | Posterior probabilities |
| Area 10 | 0 | 0.607 |
| Area 8 | 0.95 | 0.377 |
| Area 7 | 0.152 | 0.148 |
| Area 9 | 0.608 | 0.118 |
| Area 6 | 0.95 | 0.1 |
| (a)This summary is identified based on the lowest squared distance in the entire classification and the related highest posterior probabilities in the entire classification. | ||
Table 4. Summary of misclassification observations.
Our results and analysis predict the equation 1 to be reduced into the following equation 2:
F=βo + β1 Area 10+ β2 Area 8+ β3 Area 7+ β4 Area 9+ β5 Area 6+ ε (2) Area=Antineoplastic drugs (Area for cancer diseases).
Area 8=Alimentary tract and metabolism (Area for digestive diseases).
Area 7=Sensory organs drugs (Area for eyes, ears, nose, or tongue diseases).
Area 9=Dermatologics (Area for skin diseases).
Area 6=Anti-infectives (Area for infectious diseases).
From equation 2, despite the possibility to predict which areas of new drugs and diseases (as in our study) can lead to the choice of low or high research and development, pharmaceutical companies have to prepare their strategies in accordance to the strategies of cost management as to reduce the cost of drugs and help people find suitable drugs of suitable prices, and subsequently, they can obtain the competitive advantage in the market, and improve their social responsibilities.
As a result, the research question of “will pharmaceutical companies prefer low research and development cost or high research and development cost to produce new drugs for various areas of diseases?” can be answered as: “Pharmaceutical companies prefer High research and development cost when developing new drugs for new diseases”. Therefore, the postulation of cost reduction and competitive advantage is not supported by our study and by the pharmaceutical companies in this field of drugs production, where they heavily rely on engineered innovative formulations.
Accordingly, the H1 is rejected because of such preferences of pharmaceutical companies to the high research and development cost, and apparently, because they cannot adopt the postulated strategies of cost reduction and creating a competitive advantage.
Pharmaceutical companies tend to choose engineered innovative formulations when they plan for new projects to produce drugs and diseases treatments. Therefore, the cost of research and development are becoming higher in the recent time all over the world. On the other hand, some other pharmaceutical companies may tend to choose lower cost of research and development cost for their new projects.
As a consequence, in this paper, we focus on investigating whether the importance of reducing the cost of research and development and creating a competitive advantage is favourable to the pharmaceutical companies. Over the innovation expansion, and the implementations of strategies that lead to high research and development cost of producing the new drugs needed for various areas of diseases’ treatments. Whereas, we predict this cost to be low if such postulations are applied.
We use a discriminant analysis model with linear discriminant function to predict how pharmaceutical companies will prefer their cost of research and development, in the meantime, predict whether pharmaceutical companies will prefer the postulation of cost reduction and competitive advantages or the highly engineered innovative formulations that lead to high research and development costs, accordingly lead to high drug prices in the international markets.
Our results indicate a discriminant approach to identify the most significant areas of diseases expected to influence the preferences of pharmaceutical companies when comparing between the high research and development cost and the low research and development cost, Subsequently, our results and analysis predict that pharmaceutical companies will prefer high research and development cost for the multiple areas of new drugs and diseases rather than low cost.
The results also confirm the separation of group A and B of the pharmaceutical companies, and prove the effect of the areas of new drugs and diseases on the group B is more than it is on group A. And the areas are more obvious in the areas for antineoplastic drugs (for cancer diseases), alimentary tract and metabolism (for digestive diseases), sensory organs drugs (for eyes, ears, nose, or tongue diseases), dermatologics (for skin diseases), and anti-infectives (for infectious diseases).
This paper contributes to the literature of medicine and cost and management accounting, by highlighting how the preferences of pharmaceutical companies to high innovations for multiple new projects to produce new drugs or diseases will lead to high research and development cost and high prices for the drugs internationally, in addition to the effect of the economic fluctuations and recessions, and in the meantime the undermining of cost and management accounting strategies to reduce the cost and create competitive advantages.
Our recommendations to the future research are to replicate our study and use another large sample of the pharmaceutical companies and their research and development cost strategies in various countries, for the purpose of continuously investigating the postulations of cost reduction and creating competitive advantages, and as consequence sitting a strategy to provide low price drugs of high treatments efficiency under the authority of the pharmaceutical regulatory affairs.
[Crossref] [Google Scholar] [PubMed]
[Crossref] [Google Scholar] [PubMed]
[Crossref] [Google Scholar] [PubMed]
[Crossref] [Google Scholar] [PubMed]
[Crossref] [Google Scholar] [PubMed]
[Crossref] [Google Scholar] [PubMed]
[Crossref] [Google Scholar] [PubMed]
[Crossref] [Google Scholar] [PubMed]
Citation: Elnashar TA, et al. "Discriminant Analysis to Multiple Pharmaceutical New Projects: A Postulation for Cost Reduction and Competitive Advantage". J Biol Todays World, 2025, 14(1), 1-6.
Received: 17-Jul-2023, Manuscript No. JBTW-23-107942; Editor assigned: 19-Jul-2023, Pre QC No. JBTW-23-107942 (PQ); Reviewed: 02-Aug-2023, QC No. JBTW-23-107942; Revised: 03-Feb-2025, Manuscript No. JBTW-23-107942 (R); Published: 10-Feb-2025, DOI: 10.35248/2322-3308.25.14(1).002
Copyright: © 2025 Elnashar TA, et al. This is an open-access article distributed under the terms of the Creative Commons Attribution License, which permits unrestricted use, distribution, and reproduction in any medium, provided the original author and source are credited.