Method Article - (2022) Volume 3, Issue 1
From the past decade, the researcher makes use of deep learning techniques for their research. The objective of various applications is achieved using these techniques. Alzheimer’s is a physical brain disease, recently much research is going on to develop an efficient model to diagnose the early stages of Alzheimer’s. The deep learning technique in the medical field helps to find medicines and diagnosis of disease. In this paper, we experimented Hybrid model, which is a combination of VGG19 and additional layers, and a CNN deep learning model for detecting and classifying the different stages of Alzheimer’s. and compare their performance it shows that the Hybrid model works efficiently in detecting and classifying the different stages of Alzheimer’s. We analysed the model for the Magnetic resonance imaging dataset.
Alzheimer’s • Data pre-processing • VGG19 • CNN • Deeplearning
Alzheimer's Disease (AD) is a constant neurodegenerative illness that generally begins at an older age and starts deteriorating after some time. AD starts from the hippocampus (brain area where the memory is formed) and progresses in a central-fugal way towards different regions of the brain [1,2].
The total cost spent on treating dementia across the world in 2015 was approximately US $818 billion equal to 1.1% of global gross domestic product. Currently, the worldwide annual expenditure on treating dementia is US $1 trillion. According to World Health Organization (WHO), AD is the most popular type of dementia. Dementia not only affect older people but also affects individual below 65 and this accounts for up to 9% of affected cases. The AD advancement occurs in 3 stages. In the first stage of AD brain nerve cells start to damage, this stage is very difficult to differentiate from normal because an individual does not experience any detectable symptom. The next stage is Mild Cognitive Impairment (MCI), in this stage individual experiences a problem related to thinking capability. During this stage, individuals are not fully dependent on others for their tasks. The final level is Alzheimer's. At this level, individuals have more cognitive and behavioural changes and affect their daily activities [3].No medicine will stop AD but can slow down the progression of AD. Recently a team of Bengaluru scientists discovered the small molecule TGR63 that can avoid the mechanism that results in neurons dysfunctional in Alzheimer's disease [4]. In Alzheimer's patients, the tissues and cerebral cortex shrink, and brain chambers consist of cerebrospinal fluid expansion. These effects are used to find the progression of AD [5].
Many scientists have made sincere efforts to discover a variety of techniques to detect Alzheimer's using MRI data. Those techniques include the extraction of discriminative features from a large set of features, and selecting efficient classification models from machine techniques. In the existing system, we observed that the classification of AD is binary, where they determine if it is Alzheimer's disease or not. In our proposed system, we aim to achieve a fourway categorization of AD from Magnetic Resonance Imaging (MRI) using Visual Geometry Group (VGG19) architecture.
VGG-19 is a deep neural network architecture that contains 19 layers, a model is created using VGG19 architecture to detect different stages of AD [6].
Related work
This section briefly discusses the few methods used by the authors to diagnose AD using an MRI dataset. Braulio Solano- Rojas used a threedimensional densenet neural network for diagnosing AD using magnetic resonance imaging [7]. The Author constructed a deep neural network classifier with metrics of 0.86 mean accuracy, 0.86 mean sensitivity (micro-average), 0.86 mean specificity (micro- average), and 0.91 area under the receiver operating characteristic curve (micro-average) for the task of discriminating between five different disease stages or classes such as Cognitive Normal, Significant Memory Concern, Early Mild Cognitive Impairment, Mild Cognitive Impairment, Late Mild Cognitive Impairment, Alzheimer’s Disease [8]. Proposed a new classifier Ensemble developed by combining Convolution Neural Network (CNN) for feature extraction and Ensemble Learning (EL) for classification. The performance of the ensemble was evaluated using a stratified fivefold cross-validation method 10 times and achieved an accuracy of 0.84% ± 0.05%. The experimented with a new method described as Universal Support Vector Machine-based Recursive Feature Elimination (USVMRFE) and achieved a classification accuracy of 100% for CN vs AD, 90% for CN vs MCI, and 73.68% [9]. We tried with 3D-CNN-SVM method on the ADNI dataset for detection of AD [10]. The author used 3D CNN for feature extraction and the SVM method for classification and achieved an accuracy of 95.74%. One used a convolution neural network to predict AD on the ADNI dataset and achieved an accuracy of 66.9%. Other performed Classification of Alzheimer's Disease using MRI Images of Kaggle dataset [11]. The author utilized CNN Based Resnet model with additional layers and achieved an accuracy of 90%. Rajendra Acharya used Shearlet Transform (ST) and K-Nearest Neighbour (KNN) for feature extraction and classification models respectively [12]. They achieved an accuracy of 94.54%, on the dataset from the University of Malaya Medical Centre. Thavavel proposed a framework that employs Significance Analysis of Microarray (SAM) to select the most relevant features and used ensemble classifier for classification and achieved an accuracy of 87% did their experiment on the Kaggle dataset [13]. Acharya described the detection of AD using brain MRI through Shearlet Transform (ST) feature extraction technique and done classification via the K-Nearest Neighbour method [14]. The Author Achieved an accuracy of 94.54%. Few authors used the deep neural networks and achieved an average accuracy of 88% ± 5% [15-19].
Proposed work
The existing method to diagnose AD discussed in section 2 gives the average result, still to achieve the best efficiency we tried with deep learning model VGG19 with CNN.
Dataset
Consider the Kaggle dataset that consists of 4 classes of images are shown in Figure 1 where 0 indicates Non-Dementia (ND), 1 indicates very mild dementia, 2 denotes mild dementia, and 3 indicates moderate dementia [20]. Data count of each classes are given in Table 1.

Figure 1: Kaggle dataset samples 0: ND, 1: VMID, 2: MID, 3: MOD.
| Classes/Count | Kaggle_Dataset_Count |
|---|---|
| ND | 3200 |
| VMD | 2240 |
| MID | 896 |
| MOD | 64 |
Table 1. Data counts of each class are given.
Model 1 hybrid model
The hybrid model is a combination of VGG19 and additional layers, using VGG19 for feature extraction and additional CNN layers for classification. The VGG19 is a deep learning model consists 19 layers in depth. It consists of feature extraction and classification layers. Here we do not consider the classification layer. Done the Classification by adding additional layers as shown in Figure 2.

Figure 2: VGG19 and CNN.
Model 2 CNN
Model 2 considered the CNN model for both feature extraction and classification. And the architecture of the model is shown in Figure 3.

Figure 3: CNN model.
As shown in Figure 3, the feature extraction model consists of 5 convolution layers, each layer followed by the max- pooling layer. The convolution layer is used to extract the features and the pooling layer is used to shrink the input. The input image is of size 176X 176X 3 feed to the feature extraction model the size of the output image is 5X 5X 256X. This output is passed to the classification layer, It consists of base layers, 5 dense layers connected together and the classification layer consists of 4 neurons for 4 classifications. This model achieved an accuracy of 83.53%.
Working architecture
The working flow of the entire system is depicted in Figure 4

Figure 4: The working flow of the entire CNN model.
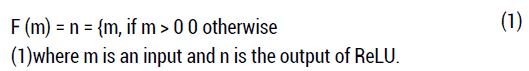
As shown in Figure 4 to increase the performance of the system input dataset is pre-processed by doing rescaling, augmentation, and data resampling. Rescaling is performed to represent the pixels of the dataset between 0 and 1 by dividing the pixels by 255.0. The rescaling is followed by Augmentation, which is performed to boom the dataset as we are using deep learning models, which require more datasets for learning. Augmentation is followed by resampling it is performed to avoid the model over fitting. After data pre-processing, it is divided into train and test datasets. Train dataset is used to make the model learn and test dataset is used to evaluate the models. Train dataset is divided into train dataset and validation dataset. The validation dataset is used to make the model generalize i.e. make the model distinguish new dataset that has never been seen before. Both the models make use of the ReLU (Rectified Linear Unit) function in intermediate layers and the Softmax function at the classifier layer for multiple classifications. The output of ReLU is the same as input if it is positive else gives false output. The Softmax selects the biggest one from the set of inputs. The ReLU and Softmax equations are represented in equations 1 and 2 respectively.
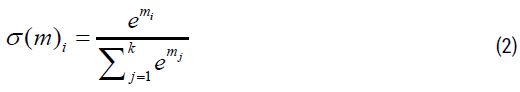
Where (m→)i is vector input to the Softmax and emi is exponential value of ith input.
This section discusses the results of both models. Model 1 and Model 2 are trained by making them run for 10 epochs. Figures 5 and 6 shows the history of accuracy and loss of model 1 and model 2. The accuracy history of model 1 is shown in Figure 5. Where the x-axis indicates epoch and the y-axis indicates percentage accuracy. As shown in the figure accuracy of a model is increases as the number of epochs increases. The training accuracy is 81% at 1st iteration and it increases to 95.52% at the 10th epoch. Figure 6 shows the accuracy history of model 2. The training accuracy is 62.34% at 1st epoch and increases to 82.65% at the 10th epoch. With respect to validation, data accuracy is 55.67% at the 1st epoch and 76.78% at the 10th epoch.

Figure 5: Accuracy history of model 1.

Figure 6: Compare the performance metric values of model 1 and model 2. This shows that model works more efficiently in detecting and classifying the stages of Alzheimerâ??s disease as compared to model.
The performance of models is evaluated using the performance metric values such as accuracy, precision, sensitivity, Specificity, and f1 score, and they are depicted in equations 3, 4, 5, 6 respectively.
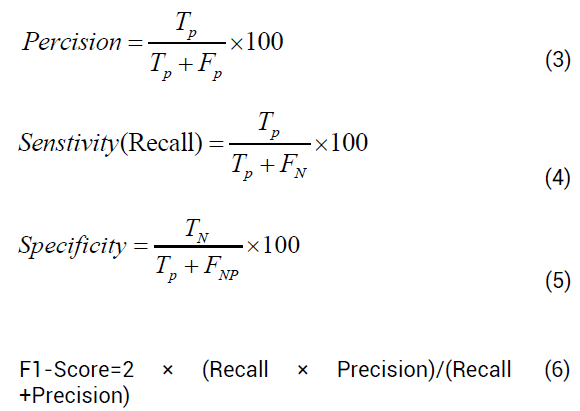
Accuracy will predict how efficiently the model will predict the output. The precision will indicate how many positive inputs are correctly classified.
In Figure 6, we compare the performance metric values of Model 1 and Model 2. This shows that Model 1 works more efficiently in detecting and classifying the stages of Alzheimer’s disease as compared to Model.
Alzheimer’s is a neurodegenerative brain disease, no medicine can cure this disease but early detection can help patients to do plan for their future. In this paper, we have experimented with two deep learning models for detecting and characterizing stages of disease in that the Hybrid model shows the best performance compared to CNN. In the future let experiment with another dataset from different organizations and also plan to use different modality datasets for the experiment.
Citation: Nagarathna C R. Automatic Diagnosis of Alzheimer’s Disease Using Hybrid Model and CNN. Int J Innov Res Sci Eng Tech 2022,3(1), 001-004
Received: 29-Dec-2021, Manuscript No. IJIRSET -50853; Editor assigned: 31-Dec-2021, Pre QC No. IJIRSET-22-50853(PQ); Reviewed: 12-Jan-2022, QC No. IJIRSET-50853(QC); Revised: 16-Jan-2022, Manuscript No. IJIRSET-50853(R); Published: 21-Jan-2022, DOI: 10.35248/ijirset .22.3.(1).1-4.
Copyright: © 2022 Nagarathna C.R., & Kusuma, M.I. This is an open-access article distributed under the terms of the Creative Commons Attribution License, which permits unrestricted use, distribution, and reproduction in any medium, provided the original author and source are credited.